Category: Finance

  • Is 3.5% Better Than the 4% Rule?

    Is 3.5% Better Than the 4% Rule?


    Confused about the 4% retirement rule? Discover why experts like Bengen keep changing the safe withdrawal rate—and why 3.5% may be safer in India.

    Retirement planning often boils down to one practical worry: “How much can I safely withdraw from my nest egg each year so the money lasts as long as I do?”
    The answer people hunt for is a single number: the Safe Withdrawal Rate (SWR). The most famous of them is the 4% Rule, born from William Bengen’s research in the 1990s. But over three decades Bengen has refined his view several times — and those changes matter. This article explains why Bengen changed his recommendations, the assumptions behind his numbers, why the U.S. findings don’t map neatly to India, and why — for most Indians — 3%–3.5% (and as low as realistically possible) is the safer zone.

    Safe Withdrawal Rate India: Is 3.5% Better Than the 4% Rule?

    Safe Withdrawal Rate India

    What exactly is a Safe Withdrawal Rate (SWR)? — Simple language

    SWR answers a practical question: from a retirement corpus, how much can you take out in the first year, then increase that amount every year to match inflation, and still expect the money to last (for a set horizon like 30 years)?

    Example (simple): retire with Rs.1 crore.

    • A 4% SWR means withdraw Rs.4,00,000 in year one. In year two, increase the rupee amount by the inflation rate (to keep purchasing power). Repeat each year. The SWR is “safe” if, historically, that plan survived for the retirement horizon being tested.

    Two things to remember:

    1. SWR is an estimate based on historical data and specific portfolio assumptions.
    2. It is not a guarantee — it depends on future returns, inflation, and how long you live.

    Refer my earlier post on SWP and how it is actually misguided in this financial world “Systematic Withdrawal Plan SWP – Dangerous concept of Mutual Funds

    William Bengen — where the 4% came from (and the data behind it)

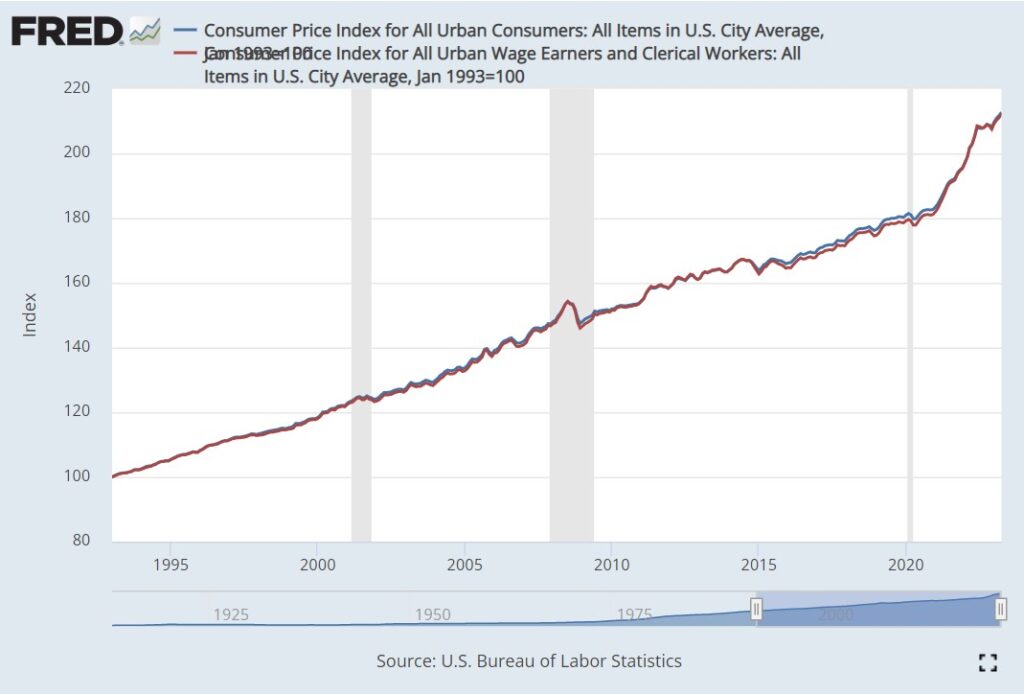
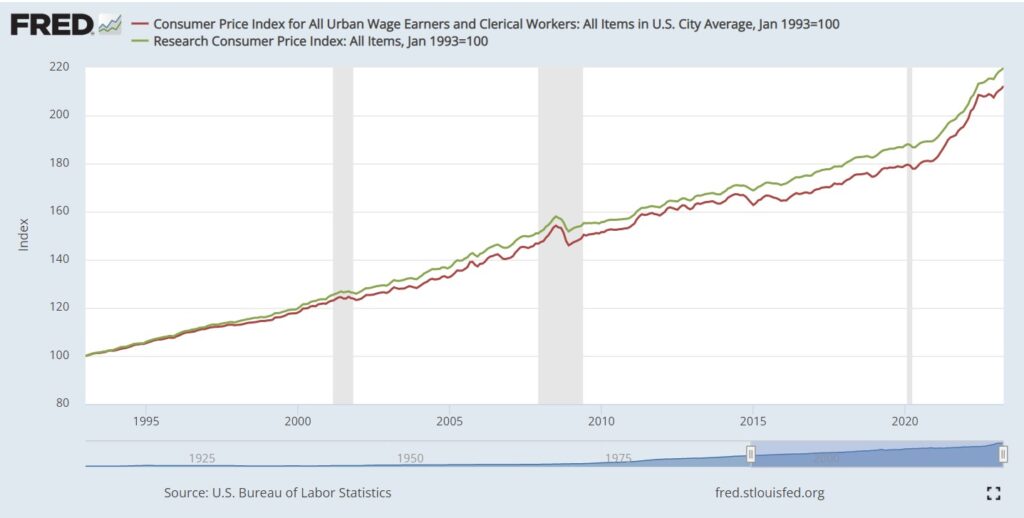
    In 1994 William Bengen analysed long-run U.S. historical returns (stocks and bonds back to 1926). He tested many starting years and withdrawal rates for a 30-year retirement horizon. His headline result: 4% (first-year withdrawal, then inflation adjustments) would have survived almost all historical 30-year retirements in the U.S.

    Important details that are often missed:

    • Portfolio assumed: Bengen’s tests assumed a balanced portfolio — roughly 50–75% in U.S. equities (mainly large-cap stocks) and 25–50% in intermediate-term government bonds. The 4% result depends on staying invested in this mix and not panic-selling after crashes.
    • Worst starting year: one of the toughest historical start years was 1966, which produced a maximum sustainable rate around 4.15% in Bengen’s backtests. He rounded down to 4% as a conservative, easy-to-remember rule.
    • Not a law: Bengen’s result was empirical — “it survived in historical data” — not a universal mathematical truth.

    How and why Bengen revised his recommendations over time

    Bengen did not proclaim “4% forever” and stop. As markets changed and he ran new tests, he updated his findings. Summarised:

    Period / Research Phase Portfolio Assumption Bengen’s suggested SWR (approx) Why he changed
    1994 (original) 50–75% US equities + bonds 4.0% Historical worst-case (e.g., retirement starting 1966) survivals led to 4% as conservative round number.
    Late 1990s–2000s Add U.S. small-cap exposure 4.5%–4.7% Small caps historically improved long-term returns and survival rates in backtests.
    2010s Same assets, but much lower bond yields & higher equity valuations ~3.5%–4.0% Lower expected future returns (low bond yields, expensive stocks) reduced the sustainable withdrawal estimates.
    2020s (recent) Emphasis on adaptability No single fixed % Bengen began arguing for flexible withdrawals — spend more in good markets and cut back in bad markets.

    So his “changing” is not flip-flopping for fun — it reflects different inputs (asset mix, valuations, bond yields) and modern caution about lower future returns.

    The “flexible withdrawals” problem — theory vs. retiree psychology

    In recent interviews Bengen has emphasised a flexible approach: raise withdrawals when markets are strong, cut when markets are weak. Academically it’s sensible — it preserves capital and reacts to reality.

    But for retirees this raises real problems:

    • Predictability matters more than optimization. Retirees prefer a steady, reliable income to budgeting and planning life. Telling them “cut spending if markets fall” is easy on paper but painful in practice — you cannot easily shrink medical care, a dependent’s education, or recurring commitments because markets fell.
    • Behavioral risk: Many retirees panic-sell in bear markets. A strategy that requires frequent adjustments increases the chance of emotionally driven mistakes.
    • Practicality: Monthly bills, EMIs, care costs — families need income predictability.

    So while flexible withdrawals are a valid tool, they must be used carefully — not as the default approach for retirees who value stability.

    Sequence of Returns Risk — the silent danger everyone misses

    Sequence of returns risk means the order of investment returns matters when you are withdrawing money. Two portfolios with identical average returns can behave very differently for a retiree, depending on whether the bad years arrive early or late.

    Illustration (simple simulation, same average returns but different order):

    Assumptions for illustration:

    • Corpus: Rs.1,00,00,000 (Rs.1 crore)
    • Initial withdrawal: 4% = Rs.4,00,000 each year (for simplicity, we keep withdrawals constant here to highlight the order effect — this isolates sequence risk)
    • Average return target across the 10-year window: 6% per year.

    We construct two 10-year return sequences with the same average (6%):

    • Good-first: big positive returns in the early years, modest thereafter.
    • Bad-first: the same returns but in reverse order (big negatives early, big positives later).

    Key balances after withdrawals (selected years):

    Year Good-first balance (Rs.) Bad-first balance (Rs.)
    1 1,21,00,000 96,00,000
    2 1,35,14,999 92,00,000
    5 1,48,33,519.75 81,68,000
    10 1,31,30,190.15 1,11,96,650.48

    Interpretation:

    • With good returns early you build a buffer; the portfolio grows even while you withdraw.
    • With bad returns early you shrink the base and may be forced to cut withdrawals or sell when prices are low. Even if later years are good, the early damage can leave you emotionally and financially worse off.

    Lesson: If a portfolio faces severe negative returns early in retirement, withdrawals can do permanent damage. Sequence risk is one of the main reasons to be conservative early in retirement.

    Worked example: Rs.1 crore corpus, 6% inflation — 4% vs 3.5% withdrawal

    Real retiree concern: how big is the difference between 4% and 3.5%? Even a half-percent sounds small, but it compounds.

    Assumptions:

    • Corpus = Rs.1,00,00,000 (Rs.1 crore)
    • Inflation = 6% annually
    • Two withdrawal rules: 4% and 3.5% (first-year withdrawal amounts; each year the rupee withdrawal increases by 6% to keep up with inflation)

    Initial withdrawals (year 1):

    • 4% – Rs.4,00,000
    • 3.5% – Rs.3,50,000

    Inflation-adjusted withdrawals (selected years):

    We compute withdrawal in year n as initial withdrawal × (1.06)^(n?1).

    Year 4% path (Rs.) 3.5% path (Rs.)
    1 4,00,000 3,50,000
    10 6,75,792 5,91,318
    20 12,10,240 10,58,960
    30 21,67,355 18,96,436

    (Example calculations: Year 10 withdrawal at 6% inflation means multiply initial withdrawal by 1.06^9. For 4%: 4,00,000 × 1.06^9 ? Rs.6,75,792.)

    Cumulative nominal withdrawals over 30 years (sum of each year’s withdrawal):

    • 4% path – Rs.3,16,23,274 (~Rs.3.16 crore)
    • 3.5% path – Rs.2,76,70,365 (~Rs.2.77 crore)

    Difference over 30 years: ~Rs.39.53 lakh (? Rs.39,52,909)

    What this shows: that modest initial conservatism (0.5% less withdrawal) yields a significantly lower drawdown on the corpus over decades, giving better chance of survival and flexibility against bad returns, higher-than-expected healthcare costs, or longevity surprises.

    Monte Carlo Simulation: Testing 3%, 3.5%, and 4% Withdrawal Rates in India

    When it comes to retirement planning, rules of thumb like the 4% rule can be useful but often don’t reflect Indian realities. To see how safe different withdrawal rates are for Indian retirees, I ran a Monte Carlo Simulation.

    What is Monte Carlo Simulation?
    It’s a method where we run thousands of “what if” scenarios with different combinations of stock and bond returns. Instead of assuming the market grows smoothly, it captures volatility — the ups and downs that retirees actually face.

    Assumptions Used

    • Portfolio: 50% Nifty 50 TRI (equity) + 50% 10-Year Government Securities (G-sec)
    • Nifty 50 expected return: 10% per year, volatility: 18%
    • G-sec expected return: 7.5% per year, volatility: 3%
    • Correlation between equity and debt: -0.2 (mildly negative)
    • Inflation: 6% per year
    • Retirement horizon: 30 years
    • Initial corpus: Rs.1 crore
    • Withdrawal tested: 3%, 3.5%, and 4% of initial corpus (inflation-adjusted every year)
    • Simulations: 10,000 random paths

    Results at a Glance

    SWR 10th Year Median Corpus 20th Year Median Corpus 30th Year Median Corpus 30-Year Survival Probability
    3.0% Rs.1.68 Cr Rs.2.74 Cr Rs.4.25 Cr 96.5%
    3.5% Rs.1.58 Cr Rs.2.36 Cr Rs.3.09 Cr 89.9%
    4.0% Rs.1.49 Cr Rs.1.97 Cr Rs.1.95 Cr 77.7%

    The takeaway: Lower withdrawal rates not only increase safety but also leave behind a much larger legacy corpus.

    Chart 1 – Median Corpus Growth Over 30 Years

    Median Corpus Growth Over 30 Years

    Interpretation:
    At 3% withdrawal, the corpus grows steadily and rarely faces depletion. At 4%, the median corpus stagnates, showing much higher risk of running out of money.

    Chart 2 – Probability of Corpus Survival (30 Years)

    Probability of Corpus Survival

    Interpretation:
    At a 3% withdrawal, the portfolio lasts for 30 years in almost 97% of cases. At 4%, it drops to 78%. This difference is huge and shows why “4% rule” may be too risky in the Indian context.

    Why This Matters for Indian Retirees

    • Volatility tolerance: Western retirees often keep 60–75% in equity even in retirement. In India, most are uncomfortable with that risk, so caution is needed.
    • Sequence of returns risk: If a bad stock market hits in your early retirement years, higher withdrawals (like 4%) can destroy the corpus.
    • Safer zone: For Indian retirees, 3% to 3.5% withdrawal seems much safer and practical. If you can live with even less, that’s the best insurance against uncertainty.

    Disclaimer – The Monte Carlo results presented above are based on historical return assumptions of Nifty 50 TRI and 10-year Government Securities. Actual future returns may differ significantly due to market cycles, interest rate movements, inflation, and economic conditions. These charts show probabilities, not guarantees. Investors should treat this only as an educational illustration and not as personalized financial advice. Always review your withdrawal strategy regularly and adjust based on your actual portfolio performance and spending needs.

    Why the U.S. 4% rule is tricky for India (a detailed look)

    1. Higher long-term inflation in India
      U.S. historical inflation is ~2–3% (for many decades). India’s long-term average has been higher — often ~5–6% or more. Higher inflation increases future spending needs quickly, meaning withdrawals grow faster in rupee terms.
    2. Different debt market & yields
      Bengen’s tests included long-term U.S. government bonds with long, steady histories. India’s debt market structure, tax rules, and yields are different. Predictable long-term “safe” returns like long-duration treasuries are a weaker assumption here.
    3. Equity culture and behavioral comfort
      Bengen’s 4% assumptions require holding 50–75% equity even during retirement. Many Western retirees are more comfortable with equities because they have long, multigenerational experience with public markets. Indian retirees are generally newer to equity investing — a 50–75% equity posture during retirement and then seeing a 30% market decline is emotionally brutal. People often sell at the worst time.
    4. Longevity
      Indians, especially in urban areas, are living longer. A retirement horizon of 30 years may be too short — more may need 35–40 years of sustainability.

    These factors make the 4% rule unreliable as a direct transplant into Indian retirement planning.

    Practical, detailed advice for Indian retirees (how to translate this into action)

    1. Target a conservative SWR: 3%–3.5%
      • 3% if you want maximum safety and can accept lower spending initially.
      • 3.5% if you want a middle path — reasonable spending now with better odds of lasting.
      • 4% should be used only if you are comfortable with high equity exposure and with the emotional stress of volatility.
    2. Use the bucket strategy (detailed):
      • Bucket 1 (0–7/10 years): cash + short-duration debt + liquid instruments — enough to fund near-term withdrawals. This removes the need to sell equities in a down market.
      • Bucket 2 (next 10–15 years): blend of debt and moderate equity (25–40%) — aim for some growth while preserving capital.
      • Bucket 3 (long term): higher equity (40–50%) for growth to combat longevity and inflation. Move money into nearer-term buckets on a planned schedule.
    3. Keep guaranteed income where possible
      • A small portion invested in annuities or a pension-like product can buy sleep — a fixed floor to meet essential expenses. Even small guaranteed income reduces sequence risk and allows equities to do their job.
    4. Plan for health inflation separately
      • Medical costs often rise faster than CPI. Keep a separate health corpus or make sure health insurance is robust.
    5. Choose an equity allocation you can emotionally live with
      • If you cannot handle 50–75% equity, don’t force yourself for theoretical higher SWR. The benefit of a lower equity allocation is peace of mind; the cost is likely a lower sustainable withdrawal rate — so reduce SWR accordingly.
    6. Avoid knee-jerk reactions on market swings
      • Stick to the plan — but if markets crash and your withdrawals threaten long-term sustainability, reduce discretionary spending (vacations, downscaling luxuries) rather than forced selling of growth assets.
    7. Review every 2–3 years (not daily)
      • Check the plan, not the daily NAV. Use multi-year reviews to make measured adjustments.
    8. Watch for fees and taxes
      • High fund fees and taxes compound the problem. Use low-cost funds and tax-efficient withdrawal sequencing (tax-exempt vs taxable buckets).

    Bottom line — the simple sentence to remember

    William Bengen gave us a hugely valuable rule of thumb — but even he changed it as markets and data changed. He proved the method (test historically, examine asset mixes), not a single permanent number. For most Indian retirees: aim for a withdrawal rate in the 3%–3.5% range, keep equity exposure at a level you can emotionally handle, use buckets and some guaranteed income, and be conservative early in retirement because sequence risk is real.
    And always remember: lower withdrawal = more peace of mind.

    For Unbiased Advice Subscribe To Our Fixed Fee Only Financial Planning Service

  • 3 Year Wealth Goals: Plan Smart, Not Just Hope

    3 Year Wealth Goals: Plan Smart, Not Just Hope


    Every investor sets out with specific wealth goals—whether it’s securing a child’s education, arranging funds for a home purchase, or building a financial cushion for unforeseen needs. The challenge, however, lies in matching these goals with realistic timelines.

     A common belief is that a three-year horizon is sufficient to generate substantial wealth through equity mutual funds or other so-called “high-return” options. But is that truly a strategy—or just optimism in disguise? While short-term aspirations are natural, bridging them with practical outcomes is where most investors struggle. 

    In this blog, we’ll explore the pitfalls of unrealistic return expectations, what history reveals about equity performance over three years, and how to create a mature investment plan that balances ambition with reality.

    The Wishful Thinking Trap

    One of the biggest dilemmas investors face is confusing hope with strategy. Many expect:

    • High returns with low risk
    • Capital safety with liquidity
    • Quick growth without volatility

    It sounds perfect, but in reality, it’s like wanting a luxury vacation without spending money. Markets don’t reward this kind of wishful thinking. Equity mutual funds, especially mid- and small-cap categories, have historically shown the potential to generate more than 20% returns in a few instances. But the same categories have also produced disappointing, and sometimes negative, outcomes in the same timeframe.

    This is where most investors get caught—they focus only on the best-case numbers without understanding the range of outcomes.

    What the Numbers Say: Category-Wise Reality Check

    When you look at how equity funds have performed over different three-year periods in the past decade, the picture is mixed—sometimes rewarding, sometimes disappointing.

    • Large-cap funds: These are the most stable among equity options. Over three years, they generally stay in the 10–15% range and only occasionally cross 18%. Good for steadiness, but unlikely to double your money quickly.
    • Mid-cap funds: They have delivered 20%+ returns in nearly half the cases, which looks attractive. But the same funds have also turned negative in bad cycles. So, depending on when you enter, you could either see great growth or unexpected losses.
    • Small-cap funds: These offer the highest growth potential and often top 20% returns. But they also come with sharp corrections—sometimes leaving investors with less than their original capital if the timing is unlucky.
    • Flexi-cap funds: By mixing large, mid, and small caps, these provide some balance. They smoothen volatility, but even here, 20%+ over three years is not consistent.

    Equities can be exciting when they work in your favor, but over a short horizon like three years, they can just as easily backfire. If your wealth goals are short-term, betting entirely on equities is like flipping a coin—you could win big, but you could also walk away with less.

    The Risk of Relying on Best-Case Scenarios

    It’s easy to get carried away by the best numbers we see in brochures or advertisements. But building your entire plan on those outcomes can be dangerous.

    Take an example: if you invest ₹10 lakh and dream of it becoming ₹17–18 lakh in three years, you may ignore the fact that, in a bad cycle, the same investment could shrink to around ₹7 lakh. That’s a big gap between expectation and reality.

    The reason is simple—equity markets are volatile in the short run. A three-year horizon is too short for the market to recover if it hits a downturn, which means your money could be stuck at the wrong time.

    On top of that, human behavior adds to the problem. When returns disappoint, investors often panic, redeem at the lowest point, and end up locking in losses that could have been avoided with patience.

    So, while chasing eye-catching returns may sound tempting, ignoring the downside risk can derail your wealth goals. It’s just like running a household budget—you can’t plan only for income while pretending expenses don’t exist.

    A Grown-Up Investment Plan

    If your wealth goals are strictly three years away, equities shouldn’t form the core of your portfolio. Here’s what a mature investment plan looks like:

    1. Short-Duration Debt Funds

    These funds invest in bonds with shorter maturities and have shown near-zero chances of negative returns over three-year periods. Historically, they have delivered a consistent 5–7% annual return. Not flashy, but highly dependable.

    2. Target-Maturity Funds

    These are predictable, debt-oriented instruments aligned with specific maturity dates. They offer better visibility of returns and are less sensitive to short-term market swings.

    3. Hybrid Approach

    If you still want equity exposure, cap it at 20–30% of your portfolio and place it in large-cap funds. This adds growth potential without overwhelming your risk profile.

    4. Emergency Buffer

    Keep a portion in ultra-short duration funds or high-quality fixed deposits. Liquidity and safety matter when your timeline is limited.

    By blending these options, you create a portfolio that balances capital protection with reasonable growth. It may not hit the 20% jackpot, but it will ensure your three-year wealth goals don’t turn into a nightmare.

    Equity Isn’t the Villain, But It Needs Time

    Sometimes, when we talk about the risks of equities in the short term, investors feel the message is “anti-equity.” That’s not true at all. In fact, equity is one of the most powerful long-term wealth creators. It consistently beats inflation, builds real purchasing power, and helps achieve life’s bigger milestones—like retirement, children’s education, or buying property.

    The challenge lies in the time factor. Equity is not designed for short sprints; it’s built for marathons. Short-term movements are unpredictable and can swing sharply, but given enough years, the ups and downs even out, allowing the true compounding effect to work.

    Here’s how timeframes matter:

    • Large-cap funds: These are relatively stable, but they still need at least 5 years to show their strength. Anything shorter, and the returns can look disappointing.
    • Mid-cap funds: With higher growth potential comes higher volatility. To balance out the swings, you should ideally hold them for 7–10 years.
    • Small-cap funds: These can multiply wealth but also experience the steepest falls. They require 10 years or more for the risks to average out and for growth to truly shine.

    So, if your wealth goals are short-term—say within three years—it’s wiser to prioritize stability through debt funds or other safer avenues. On the other hand, if your goals are long-term, equities deserve a prominent place in your portfolio.

    The mistake many investors make is mixing the two—using equity for short-term needs or expecting steady, “safe” returns from it. That mismatch between goals and timelines is often the real cause of disappointment, not the asset class itself.

    Conclusion: Invest Like an Adult, Not a Dreamer

    Setting wealth goals is the first step toward financial maturity. But chasing unrealistic returns in three years is less about planning and more about hoping. And hope isn’t a strategy.

    A grown-up investor recognizes that:

    • Three years is too short for aggressive equity bets.
    • Reliable wealth-building needs aligning products with timelines.
    • Risk isn’t eliminated; it is managed.

    The smarter path is to respect timeframes. Use debt funds or hybrid structures for short-term goals. Reserve equities for the long haul.

    At the end of the day, financial maturity isn’t about chasing miracles—it’s about building wealth steadily, with a plan that works across scenarios, not just in best-case outcomes.

    So the next time you think about your three-year wealth goals, ask yourself: are you planning—or just hoping?

    At Fincart, we help investors align their wealth goals with the right strategies—balancing ambition with practicality. Because building wealth is not about shortcuts, it’s about smart choices.

  • Why RD for PPF Yearly Investment is a Wrong Strategy?

    Why RD for PPF Yearly Investment is a Wrong Strategy?


    Many save in RD for next year’s PPF deposit, but this hurts returns. Here’s why monthly PPF before 5th is a smarter strategy.

    When it comes to Public Provident Fund (PPF), almost every investor knows the golden rule—deposit your money before the 5th of the month to earn interest for that month.

    Because of this, many people follow a popular strategy: they put money into a Recurring Deposit (RD) throughout the year, and in the next April (between 1st and 5th), they transfer the RD maturity to PPF as a lump sum.

    At first glance, this feels like the “best of both worlds”: you earn interest from RD for the year and still capture full-year interest in PPF. But is this really the smartest way to grow your money?

    The reality is RD for PPF yearly investment is actually a wrong strategy. By doing this, you are losing out on compounding and paying unnecessary taxes. Let’s understand this step by step with numbers.

    Why RD for PPF Yearly Investment is a Wrong Strategy?

    Why RD for PPF Yearly Investment is a Wrong Strategy?

    How PPF Interest Works

    • Current PPF interest rate = 7.1% (tax-free)
    • Interest is calculated monthly on the lowest balance between 5th and month-end
    • Credited annually, but effectively compounding works year after year
    • So if you invest Rs.10,000 before the 5th of every month, that installment earns interest for that month plus the rest of the year

    In short, the earlier you deposit each month, the more months your money earns tax-free interest.

    How RD Works (and Why It Looks Attractive)

    • Suppose you invest Rs.10,000 per month in a one-year RD.
    • After a year, the RD matures, and you transfer the maturity to PPF in April.
    • On paper, it looks smart because:
      • You earn interest in RD for 12 months
      • Then you earn PPF interest for a full year (since you invested lump sum in April)

    But here’s what’s missed:

    1. RD interest is fully taxable (added to your income, taxed at your slab rate).
      • If you are in the 30% tax bracket, a 7.1% RD earns only ~4.9% post-tax.
    2. Lost compounding – In the monthly PPF route, each installment earns tax-free compounding for 15 years. In the RD route, your PPF compounding starts one year later for each installment.

    Current 1-Year RD Rates (August 2025)

    Bank 1-Year RD Rate Post-Tax @ 30%
    SBI 6.80% 4.76%
    HDFC Bank 6.95% 4.87%
    ICICI Bank 7.10% 4.97%
    Axis Bank 7.00% 4.90%
    Kotak Mahindra 6.90% 4.83%

    Even at the best RD rates, post-tax returns are nowhere close to PPF’s 7.1% tax-free return.

    Real Comparison: Monthly PPF vs RD ? PPF

    Let’s assume:

    • You want to invest Rs.1,20,000 per year (Rs.10,000/month) for 15 years
    • Option 1: Invest monthly in PPF before 5th of each month
    • Option 2: Invest in RD, then transfer yearly lump sum to PPF in April

    Correct Simulation Results

    Year Direct Monthly PPF (Rs.) RD ? PPF Route (Rs.) Difference (Rs.)
    1 1,24,615 1,23,233 1,382
    5 7,18,060 7,10,097 7,963
    10 17,29,890 17,10,708 19,182
    15 31,55,679 31,20,687 34,993

    By the 15th year, the difference is Rs.35,000, even though we assumed RD rate = PPF rate (7.1%). In reality, since RD is taxable and usually lower, the gap will be even bigger.

    Key Observations

    1. Small leak becomes big loss – Every year, you lose a little to RD taxation and delayed compounding. Over 15 years, this adds up.
    2. Tax-free always wins – PPF’s tax-free interest makes it unbeatable compared to RD.
    3. RD is unnecessary middleman – Instead of RD, direct PPF monthly deposits give better returns without extra steps.
    4. Simplicity is the edge – With direct PPF, you don’t depend on RD maturities or tax calculations.

    Common FAQs

    1. Is lump sum in April better than monthly deposits?
    Yes, if you already have the full money available in April, lump sum is ideal. But if you don’t, then monthly deposits before 5th work best.

    2. What if my cash flow doesn’t allow monthly deposits?
    If you can only arrange funds monthly, just deposit directly into PPF instead of RD. You earn tax-free compounding immediately.

    3. Can RD still be useful?
    RD can be useful for short-term goals or as a forced saving tool, but not for building a PPF corpus.

    4. What if PPF rates change?
    Rates may change quarterly, but both lump sum and monthly deposits get the prevailing rate. The advantage of avoiding RD taxation and starting compounding early always remains.

    Myth vs Reality

    • Myth 1: Lump sum in April is always better.
      Only true if you already have cash ready. If you don’t, monthly PPF before 5th beats RD + lump sum.
    • Myth 2: RD helps earn extra returns before PPF.
      False, because RD interest is taxable and you lose a year of PPF compounding.
    • Myth 3: Difference is negligible.
      Over 15 years, the gap can be Rs.35,000–Rs.50,000 or more, depending on tax bracket and RD rate.

    Final Conclusion

    At first, using an RD to build a yearly PPF corpus looks smart. But when you factor in taxation and lost compounding, the reality is clear:

    RD for PPF yearly investment is a wrong strategy.

    If you want to maximize your PPF returns:

    • Deposit before the 5th of every month, or
    • If you have lump sum in April, deposit it right away.

    With this approach, you:

    • Earn higher, tax-free returns,
    • Avoid unnecessary RD taxation,
    • Build discipline and simplicity,
    • And walk away with a bigger maturity corpus.

    In personal finance, sometimes the smartest strategy is the simplest one. For PPF, that strategy is direct monthly deposits before 5th—not RD detours.

    Refer to all our earlier posts related to PPF-related articles here – EPF and PPF

    For Unbiased Advice Subscribe To Our Fixed Fee Only Financial Planning Service

  • 2026 Social Security Cost of Living Adjustment (COLA)

    2026 Social Security Cost of Living Adjustment (COLA)


    Retirees on Social Security receive an increase of their Social Security benefits each year known as the Cost of Living Adjustment or COLA. The COLA was 2.5% in 2025. Retirees on Social Security will once again receive a COLA in 2026. The increase will be similar to the one in 2025.

    Some retirees think the COLA is given at the discretion of the President or Congress, and they want their elected officials to take care of seniors by declaring a higher COLA. They blame the President or Congress when they think the increase is too small.

    It was done that way before 1975, but the COLA has been automatically linked to inflation for nearly 50 years. How much the COLA will be is determined strictly by the inflation numbers. The COLA is high when inflation is high. It’s low when inflation is low. There’s no COLA when inflation is zero or negative, which happened in 2010, 2011, and 2016.

    CPI-W

    Specifically, the Social Security COLA is determined by the increase in the Consumer Price Index for Urban Wage Earners and Clerical Workers (CPI-W). CPI-W is a separate index from the Consumer Price Index for All Urban Consumers (CPI-U), which is more often referenced by the media when they talk about inflation.

    CPI-W tracks inflation experienced by workers. CPI-U tracks inflation experienced by consumers. There are some minor differences in how much weight different goods and services have in each index but CPI-W and CPI-U look practically identical when you put them in a chart.

    CPI-W and CPI-U 1993-2023

    The red line is CPI-W and the blue line is CPI-U. They differed by only smidges in 30 years.

    There’s also a research CPI index called the Consumer Price Index for Americans 62 years of age and older, or R-CPI-E. This index is weighted more by the spending patterns of older Americans. Some researchers argue that the Social Security COLA should use R-CPI-E, which has increased more than CPI-W in the last 30 years.

    CPI-W and R-CPI-E 1993-2023

    The green line is R-CPI-E. The red line is CPI-W. R-CPI-E outpaced CPI-W in 30 years between 1993 and 2023, but not by much. Had the Social Security COLA used R-CPI-E instead of CPI-W, Social Security benefits would’ve been higher by 0.1% per year, or a little over 3% after 30 years. That’s still not much difference.

    Regardless of which exact CPI index is used to calculate the Social Security COLA, it’s subject to the same overall price environment. Congress chose CPI-W 50 years ago. That’s the one we’re going with.

    Q3 Average

    More specifically, the Social Security COLA for next year is calculated by the increase in the average of CPI-W from the third quarter of last year to the third quarter of this year. You get the CPI-W numbers in July, August, and September of last year. Add them up and divide by three. You do the same for July, August, and September this year. Compare the two numbers and round the change to the nearest 0.1%. That’ll be the Social Security COLA for next year.

    2026 Social Security COLA

    The average of CPI-W from the third quarter in 2025 won’t be known until Oct. 15, 2025, when the government releases inflation numbers for September. We can estimate using the CPI-W for July and fill in blanks for August and September.

    If the CPI-W in August and September stays the same as the CPI-W in July, the 2026 Social Security COLA will be 2.5%. If the CPI-W in August and September goes up at a 3% annual pace (about 0.25% per month), the 2026 Social Security COLA will be 2.7%. The difference between a 2.5% COLA and a 2.7% COLA on a $2,500 per month Social Security benefit is $5 per month.

    Because we likely will have some inflation, I estimate the 2026 Social Security COLA will be 2.7%. It’s slightly higher than the 2.5% increase for 2025.

    Medicare Premiums

    If you’re on Medicare, the Social Security Administration automatically deducts the Medicare premium from your Social Security benefits. The Social Security COLA is given on the “gross” Social Security benefits before deducting the Medicare premium and any tax withholding.

    Medicare will announce the standard Part B premium for 2026 in October. The increase in healthcare costs is part of the cost of living that the Social Security COLA is intended to cover. You’re still getting the full COLA even though a part of the COLA will be used toward the increase in Medicare premiums.

    Retirees with a higher income pay more than the standard Medicare premiums. This is called Income-Related Monthly Adjustment Amount (IRMAA). I cover IRMAA in 2025 2026 2027 Medicare IRMAA Premium MAGI Brackets.

    Root for a Lower COLA

    People intuitively want a higher COLA, but a higher COLA can only be caused by higher inflation. Higher inflation is bad for retirees.

    Whether inflation is high or low, your Social Security benefits will have the same purchasing power. You should think more about the purchasing power of your savings and investments outside Social Security. When inflation is high, even though your Social Security benefits get a bump, your other money loses more value to inflation. Your savings and investments outside Social Security will last longer when inflation is low.

    You want a lower Social Security COLA, which means lower inflation and lower expenses.

    Some people say that the government deliberately under-reports inflation. Even if that’s the case, you still want a lower COLA.

    Suppose the true inflation for seniors is 3% higher than the inflation numbers reported by the government. If you get a 3% COLA when the true inflation is 6% and you get a 7% COLA when the true inflation is 10%, you are much better off with a lower 3% COLA together with 6% inflation than getting a 7% COLA together with 10% inflation. Your Social Security benefits lag inflation by the same amount either way, but you’d rather your other money outside Social Security loses to 6% inflation than to 10% inflation.

    Root for lower inflation and lower Social Security COLA when you are retired.

    Say No To Management Fees

    If you are paying an advisor a percentage of your assets, you are paying 5-10x too much. Learn how to find an independent advisor, pay for advice, and only the advice.

    Find Advice-Only

  • Why SIP in ETF Could Be the Future of Smart Investing

    Why SIP in ETF Could Be the Future of Smart Investing


    Mutual fund SIPs have become hugely popular because they’re simple, flexible, and help you build wealth slowly without needing a big lump sum. You just need to invest a fixed amount regularly, and with time, your money grows thanks to the power of compounding. ETFs, on the other hand, were launched in 2002, so they are relatively newer investment vehicles. Many investors see them as a viable option due to their low costs and tradability, and wonder if they can start a sip in etf.

    In recent years, some platforms have allowed investors to combine the power of SIPs with ETFs. Let’s understand what exactly an etf sip is and how you can get started with it in just a few simple steps.

    What is SIP in an ETF and How Does It Work?

    An etf sip allows investors to buy a certain amount of ETFs at regular intervals, such as monthly. The basic principle behind sip in etf is the same as an SIP in a mutual fund: You invest regularly to build wealth over time in a disciplined manner. But the key difference is that mutual fund units can be fractional. For example, let’s say you invest Rs. 5,000 every month in an equity fund. If the fund’s NAV is Rs. 11.50, you’ll be allotted approximately 434.78 units. Your exact investment amount is fully utilised every month, regardless of the NAV.

    With ETFs, this works differently. When you invest in ETFs, you must buy at least 1 unit at the current market price listed on the stock exchange. Since ETFs are priced in real time, their prices fluctuate throughout the day. This means the exact amount you invest each month can change depending on the price of the ETF at the time of purchase. When you set up an ETF SIP, instead of a fixed amount of money to invest, you’ll generally need to enter the number of units you want to buy at regular intervals. Some platforms allow you to select a fixed amount, too, but in such cases, they will buy as many full units as possible within that amount, and any leftover cash will remain uninvested (or carried forward). Here’s how you can set up an ETF SIP in both ways:

    Fixed Amount of Units

    Let’s say an investor decides to buy 10 units of a NIFTY 50 ETF every month. If the ETF is priced at Rs. 280 this month, they’ll invest Rs. 2,800. Next month, if the price rises to Rs. 290, they’ll invest Rs. 2,900 for the same 10 units.

    This method is more common on stockbroking platforms, which also allow you to set price limits. For example, you can choose to buy 10 units only if the price per unit stays below Rs. 300.

    Fixed Amount of Money

    Now let’s assume you want to invest Rs. 5,000 every month in an ETF. If the ETF is priced at Rs. 200, you will buy 25 units. If next month, the price rises to Rs. 250, you’ll get 20 units. But what happens if the price rises to Rs. 300? Since Rs. 5,000 is not completely divisible by Rs. 300 (16.67), you won’t be able to invest the entire Rs. 5,000. Instead, you’ll buy 16 units of ETFs for Rs. 4,800, and the remaining amount (Rs. 200) will stay unused in your platform’s wallet.

    Benefits of Doing SIP in ETFs

    Advantages of starting sip in etf include:

    • Lower Expense Ratios: Unlike most mutual funds, ETFs are passively managed, which brings their expense ratios down substantially.
    • Diversification: When you invest in an ETF, you gain exposure to a basket of securities, which reduces your risk compared to investing in stocks individually.
    • Tradability: ETFs are listed and traded on stock exchanges, so you can trade them just like shares. Mutual funds can only be transacted once a day based on the NAV, but ETFs can be bought or sold at any time during market hours at live market prices.
    • Good for Long-Term Goals: An etf sip helps you stay disciplined, which is a key trait for successfully achieving goals like an early retirement plan, saving your child’s education, or buying a home.
    • Liquidity: You can buy or sell your ETF units at any time the market is open. However, since ETFs are relatively newer in India, not all of them have high trading volumes. If the volume is low, you run the risk of getting stuck with units that are hard to sell or having to sell at a price lower than expected. If you’re unsure about ETF evaluation, a financial consultant company can help you understand the average daily trading volume, spread between buying and selling prices, and what kind of index the ETF is tracking, so you can select ETFs that are liquid, cost-efficient, and aligned with your financial goals.

    How to Do SIP in ETFs in India?

    Setting up an ETF SIP depends on your brokerage platform, but there are some common steps that most platforms follow. Here’s a guide to get you started:

    1. Open A Demat Account

    ETFs are held in a demat account, so first, you’ll need to open one. Ensure that the platform offers an etf sip facility, since not all of them do.

    2. Select Suitable ETFs

    Choose ETFs based on your financial goals, risk tolerance, and market conditions. Most platforms allow you to create a basket of ETFs, so you can combine multiple ETFs into a single investment plan. This way, you can invest in all of them in one go.

    3. Choose SIP Mode (Fixed Units or Fixed Amount)

    Depending on the platform, you’ll either:

    • Enter the number of units you want to buy each month (for example, 20 units), or
    • Enter the amount you want to invest (for example, Rs. 3,000 per month), and the platform will buy as many whole units as possible.

    If you’re wondering how to do sip in etf using a fixed amount, you’ll need to check whether your brokerage platform offers the facility. If it does, your SIP will work similarly to how it does in the example above. Since you’ll need to buy whole units of ETFs, there will be times when your entire investment amount isn’t fully utilised, which is something to keep in mind.

    4. Set Investment Frequency and Date

    You’ll also need to enter how often you want to invest, like monthly, weekly, or quarterly, and choose your preferred date. Since ETFs are traded in real time, you can even select the exact time at which the trade will be executed. For instance, you can set up automatic purchase orders at 10:15 AM on the 5th of every month. Once all the details are entered, money will either be debited from your linked bank account or your platform’s wallet and then invested into your ETF basket.

    5. Monitor Your Investments

    You can easily track your SIP through your broker’s dashboard. Keep an eye on how well your ETFs are performing and make changes to the SIP if your financial goals or market conditions change.

    If you’re new to investing and unsure which ETFs suit your goals, you can always connect with a personal financial advisor in pune or anywhere else in India online. They can help you choose the right ETFs based on your profile, set up your SIPs correctly, and monitor and rebalance your portfolio when needed.

    SIP in ETFs vs SIP in Mutual Funds

    While the ‘Systematic Investment Plan’ part of both is the same, there are quite a few differences between an etf sip and a mutual fund SIP:

    Factor ETF SIP Mutual Fund SIP
    Demat Account A demat account is required to invest in ETFs. There’s no need to own a demat account to start a mutual fund SIP.
    Units Units cannot be bought fractionally. One must buy at least a single unit of ETF. Mutual fund units can be fractional, for example, 200.42 units.
    Price ETF prices fluctuate throughout the day. Mutual fund units are bought at the end of day NAV.
    Management Style ETFs track specific indices, so they are passive investment products. Most mutual funds are actively managed, but some, like index funds, are passively managed.
    Expense Ratios ETFs are cost-effective investments due to their passive nature. Their expense ratio is much lower than that of actively managed mutual funds. The expense ratios for actively managed funds are much higher in comparison. Even passively managed funds have higher expense ratios relative to ETFs.
    Tradability ETFs are traded on the stock exchange. Mutual fund units are redeemed by the asset management company and cannot be traded on exchanges.
    Minimum Investment Amount ETF SIPs start with at least 1 unit, so the minimum investment depends on the ETF’s price. Some AMCs allow investors to begin mutual fund SIPs with just Rs. 100 per month.
    Liquidity ETFs can be easily sold if their trading volume is high. For lesser-known ETFs, low trading volume can be a huge concern. You may find it difficult to sell your units quickly or get a favourable price due to higher liquidity risk. Mutual funds are highly liquid as they can be redeemed directly through the fund house at the day’s NAV.

    Who Should Consider ETF SIPs?

    Investors can consider starting sip in etf if:

    • They want to diversify their portfolio with passive products that simply aim to mirror an index.
    • They are comfortable with operating a demat account and trading every now and then.
    • They prefer passive investing over active fund management.
    • They are looking for long-term investment vehicles that fit into their goal based planning.
    • They want a cost-effective investment strategy, with lower expense ratios and minimal management fees compared to mutual funds.

    That said, ETFs may not suit every investor’s style. They can be a bit more complex compared to mutual fund SIPs, as you need to understand how the stock market works, be familiar with using a demat account, and be comfortable dealing with real-time pricing. If you’re confused whether an ETF SIP aligns with your financial goals or risk profile, it could be a good idea to consult a qualified financial advisor. Experts can help you assess your needs, recommend suitable ETFs, and set up your SIP the right way.

    Risks and Considerations Before Starting ETF SIPs

    You should keep the following things in mind before investing in etf sip:

    Tracking Error

    Tracking error refers to the difference between the returns of an ETF and the index it is tracking. A lower tracking error means the ETF is good at mirroring the index. You should look for ETFs with very low tracking errors to ensure your returns will be as close as possible to the index performance.

    Liquidity

    Since they are traded on stock exchanges, trading volume becomes a big consideration before selecting ETFs. If the ETF you invest in has low trading volume, you will find it difficult to buy or sell units at a fair price. Be sure to always check the average daily trading volume before starting an SIP.

    INAV

    ETFs publish INAV (Indicative Net Asset Value) every 10 to 15 seconds. This value helps you track whether you’re buying the ETF at a price close to its actual value. If there is a large difference between the INAV and trading price, you could be paying more than you should.

    Expense Ratio

    ETFs generally have lower expense ratios than mutual funds, but it is still important to compare fees among available options.

    Taxation

    ETF taxation depends on the fund’s underlying assets (equities, gold, debt) and the investment’s holding period. You should understand the tax implications of your investment before starting an SIP. A tax consultant can help you minimise capital gains tax while keeping you compliant with the law.

    Not Widely Available

    While many brokerage platforms offer ETF SIPs, the facility is still not as widely available as mutual fund SIPs. If you are a first-time investor, it’s a good idea to consult a financial advisor in kerala or any other part of India to make the entire process simpler and more effective.

    Future of SIP in ETFs in India

    Even though the first ETF in India was introduced in 2002, the government recognised it as an asset class for broader public investment only much later in 2013. Due to this government endorsement, ETFs have seen a significant rise in the country. By December 2023, the total AUM in ETFs in India had reached around Rs. 6.5 lakh crore, showing how much interest they’ve gained over the years. Many experts believe the future of ETFs is very promising.

    That said, as far as sip in etf is concerned, there is still some way to go. The number of platforms offering this facility is currently limited, and the features may vary widely. Also, not all ETFs have sufficient liquidity, which can make it harder for investors to invest in this space confidently. However, as awareness and demand for ETFs grow, more brokers will likely start offering simpler and automated ETF SIP options. Until then, if you’re unsure how to start, it’s best to seek help from a registered investment advisor who can guide you through the process based on your financial goals and risk tolerance.

    Conclusion

    While Systematic Investment Plans are usually associated with mutual funds, some platforms have made it possible for investors to start an sip in etf. This gives investors the ability to combine the benefits of disciplined investing with the cost-efficiency of ETFs. While the use of this facility is not yet widespread, it is expected that its popularity will grow as more people become aware of ETFs as investment vehicles and more brokerage platforms allow for easier automatic investments.

    FAQs

    What is an ETF SIP and how does it differ from mutual fund SIPs?

    An etf sip is a facility offered by some platforms which allows investors to automatically buy ETFs regularly. They differ from mutual fund SIPs in the following ways:

    • Investors must buy full units of ETFs, unlike mutual fund SIPs, where a fraction of a unit can be allotted.
    • ETF SIPs require a demat account, while mutual fund SIPs do not.
    • Investment in mutual fund SIPs is done with a fixed amount, for example, Rs. 5,000 per month. Generally, with ETF SIPs, you purchase a fixed number of units, not invest a fixed amount.

    How can I start an ETF SIP online?

    To start an ETF SIP, you’re going to need a demat account with an online broker platform that offers the ETF SIP facility. Once set up, you can choose the appropriate ETFs and select the quantity, frequency, and the timing of purchase.

    Is SIP in ETF safe for long-term investing?

    Since equities tend to perform best over the long term, SIP in ETFs that track indices like NIFTY 50 and NIFTY Next 50 can be a safe strategy for long-term investing. These products do carry market and liquidity risks, so you should ideally consult with a qualified advisor before investing in them.

    Can I do SIP in any ETF listed on NSE or BSE?

    Yes, if your brokerage platform offers the ETF SIP facility, you can invest in NSE or BSE ETFs.

    Which platforms allow SIPs in ETFs in India?

    Platforms like Zerodha and Groww offer ETF SIP facilities, but you should always verify whether or not a particular platform supports automatic ETF investments.

  • Child Education Plan India: Smart Guide for Parents

    Child Education Plan India: Smart Guide for Parents


    Worried about rising education costs? Learn how to save, invest, and create the best child education plan in India with smart financial planning.

    The Fear vs. The Reality

    In my previous post (Cost of Education in India 2025–2040: Fees, Living & Projections), I highlighted the actual cost of graduation and post-graduation across IITs, NITs, IIITs, top private engineering/medical colleges, and even MBA institutes in India. Many parents were shocked to see how the fees could skyrocket by 2040 when their child will enter higher education.

    Child Education Plan India: Smart Guide for Parents

    Child Education Plan India

    But being shocked isn’t enough. As parents, we need to ask:

    “How do I ensure my child’s dreams don’t get compromised because of lack of money?”

    That’s where financial planning comes in. This article is a step-by-step guide on how to prepare for your child’s higher education, with clear examples, calculations, and actionable tips.

    Step 1: Define the Goal Clearly

    One of the biggest mistakes parents make is being vague. Saying “I want to save for my child’s education” is too broad. Instead, you must define the goal in numbers.

    Here’s how:

    1. Identify the possible streams: Engineering, Medical, Law, MBA, or even Overseas education.
    2. Use actual fee benchmarks: Refer to the table in my earlier post where I broke down costs for IIT, NIT, AIIMS, BITS, RV, PES, etc.
    3. Add a safety buffer of 10–15%: Because your child may choose a different college, stream, or even a foreign degree.

    Example:
    Your child is 5 years old today. You expect he/she may go for Engineering + MBA. The 2040 projected cost (tuition + living + other expenses) may easily cross Rs.1.5–2.5 crore. That’s the target you must work with.

    Step 2: Understand Education Inflation (The Silent Killer)

    Normal household inflation in India averages around 5–6%. But education inflation is far higher:

    • IIT/NIT tuition has doubled every 7–8 years.
    • Private medical seats see fee hikes every 3–4 years.
    • Hostel, food, and living costs in metros rise at 7–8% per year.

    That’s why, when planning for higher education, you must assume 8–10% inflation.

    A degree that costs Rs.20 lakh today could cost Rs.70–75 lakh in 15 years.

    Step 3: Break Down the Timeline

    Your child’s age determines how much risk you can take in investing.

    • 0–5 years left (child in Class 12): Stick to safe debt instruments (Debt mutual funds, FDs, RDs).
    • 5–10 years left: Mix of 40% equity + 60% debt.
    • 10+ years left: Go aggressive with 50–60% equity, since time will smooth out volatility.

    Example: If your child is 5 today, you have 12–15 years. You can afford higher equity exposure. However, make sure that as the goal time horizon is just within 5-10 years, then reduce the equity exposure to not more than 40% and same way when the goal is just around less than 5 years, then move the equity portfolio to debt. This derisking process is very much important than holding the equity till the end of the goal.

    Step 4: Choose the Right Investment Products

    Here’s where most parents go wrong. They buy Child ULIPs or insurance-linked “Child Plans”. These are expensive and give poor returns. Instead, follow a three-pillar investment strategy:

    1. Equity Mutual Funds (Growth Engine)

    • Index Funds (Nifty 50, Sensex, Nifty Next 50 and Nifty Midcap 150 Index).
    • Flexi-cap or Large-cap funds for stability (if you believe in active funds)
    • Target not more than 10% long-term returns.

    2. Debt Instruments (Safety Net)

    • PPF (risk-free, tax-free returns, 15-year horizon).
    • SSY (If you have a girl child).
    • Target Maturity Debt Funds (typically acts like a FD in terms of maturity. Currently most of them invest in PSU, Central Government and State Government Bonds). But make sure that the maturity year should match your requirement. For example, if you need the money after 10 years, then chose the fund whose maturity is after 10 years.
    • Debt Funds If your goal is less than 5 years or so, sticking to a simple Money Market Fund is enough. However, if the goal is more than 5-10 years, then the mix of Money Market and Gilt Fund is better. However, do remember that once the goal time horizon reduces to less than 5 years or so, moving from Gilt Fund is of utmost important. Mixing Money Market Fund and Gilt Fund is a foolproof strategy to protect the future interest rate volatility.

    3. Gold (If you want)

    • Sovereign Gold Bonds (SGBs), or you can alternatively use the Gold ETF and Gold Mutual Funds too.

    Step 5: How Much Should You Save? (SIP Examples)

    This is the most practical question parents ask. Let’s calculate with a real example.

    Target: Rs.1.5 crore (child age: 5, need after 15 years).
    Inflation: 8%.
    Expected Returns: 10% equity portfolio and 5% from debt portfolio

    Asset allocation: 60:40 between debt to equity

    Using SIP:

    • Required SIP = Rs.47,316 per month for 15 years.

    But what if you can’t afford this?

    • Start with Rs.25,391/month today.
    • Increase by 10% every year (Step-up SIP).
    • This strategy helps bridge the gap without overburdening current finances.

    For above calculation, I have assumed that you start with the asset allocation of 60:40 between debt to equity and when the goal is around 6 years away, you reduce your equity exposure from 60% to 40% and when goal is just around 3 years away, your equity allocation will be zero. This is just for the example purpose. However, based on your own financial life and risk appetite you can modify the asset allocation.

    Step 6: Protect the Goal with Insurance

    What if something happens to you? Your child’s education dream should not collapse.

    • Take a pure Term Insurance Plan = 15–20x your annual income.
    • Don’t buy ULIPs, Child Plans, or Endowment policies. They mix insurance with investment and dilute both.
    • Ensure the education goal is protected separately.

    Step 7: Mistakes Parents Must Avoid

    Here are the most common mistakes I see in my financial planning practice:

    • Starting late (waiting until the child is already 10+).
    • Assuming the child will surely get a Govt. seat (Private/Management seats are reality for many).
    • Ignoring living costs (hostel, travel, books = 25–40% of education cost).
    • Depending on education loans blindly instead of planning early.

    Step 8: Loans vs. Investments

    Yes, education loans are available. But consider carefully:

    • Interest = 9–11%.
    • Repayment starts after course + 6–12 months.
    • Burden often falls on parents anyway.

    Better Strategy = Pre-plan with investments.
    Use education loans only as last resort.

    Step 9: A Practical Checklist for Parents

    Here’s a ready checklist to follow:

    • Identify the course/stream target (Engineering, MBA, Medical).
    • Check projected costs (from my earlier post).
    • Fix the target in numbers.
    • Start SIP/investments early (ideally before age 5).
    • Review progress every year (not every month, quarter or half yearly)
    • Protect the goal with Term Insurance.
    • Keep liquidity (avoid locking everything in PPF/SSY). Invest certain portion in Debt Funds as this may be helpful for you to reset the asset allocation when there is a huge deviation in your equity portfolio due to market fall in the future.

    Step 10: Case Study — Two Parents, Two Outcomes (just for example purpose)

    Parent A (Started Early)

    • Child age: 3 years.
    • Invested Rs.20,000/month in equity + debt.
    • Increased SIP by 10% yearly.
    • By age 18, corpus built = Rs.1.8 crore.
    • Child completed MBA without loans.

    Parent B (Delayed)

    • Child age: 10 years.
    • Started saving only Rs.25,000/month.
    • No step-up, low equity allocation.
    • By age 18, corpus = Rs.70 lakh.
    • Needed to borrow Rs.50+ lakh via education loan.

    The difference is not income, but time and discipline.

    Conclusion: Start Early, Save Smart, Stay Disciplined

    The cost of higher education in India will only rise — whether your child dreams of IIT, AIIMS, IIM, or even a foreign degree. As parents, we can’t control education inflation. But we can control when we start and how we plan.

    • Start when your child is 3–5 – Rs.25–30k/month may be enough.
    • Start when your child is 12 – you may need Rs.70–80k/month.

    The math is clear: Time is your biggest friend.

    If you missed my earlier post on the actual fee structure of IITs, NITs, AIIMS, IIMs, and private colleges (with 2040 projections), I recommend reading it here: Cost of Education in India 2025–2040: Fees, Living & Projections

    References:

    • Ministry of Education Reports (IIT/NIT fee hike circulars).
    • AIIMS and NMC official websites for MBBS fee structures.
    • AMFI (for mutual fund returns & inflation assumption).
    • RBI (for bond/PPF data).

    For Unbiased Advice Subscribe To Our Fixed Fee Only Financial Planning Service

  • 17 Bills in Your Wallet Worth More than Face Value

    17 Bills in Your Wallet Worth More than Face Value


    17 Bills in Your Wallet Worth More than Face Value

    What if I told you your money is worth more than you think? In fact, it could be worth THOUSANDS more.

    If you carry cash on a regular basis, there’s a good chance that at some point during the year you have bills in your wallet that are worth more than their stated face value. While most of these are probably worth only a few dollars more, some can be worth much, much more. It’s estimated that some of the new $100 bills coming out will be worth as much as $15,000 each for those lucky enough to find the bills with serial numbers that collectors covet.

    Dollar Bill Collectors Are Out There

    Many people don’t realize there are people who collect bills. For these collectors, it’s often the serial number on the bill which makes the bill valuable to them. What’s interesting is that collectors have different number patterns that they desire, and they’re willing to pay extra for these bills.

    The best part is that it costs you absolutely no money to do this. The bills you have in your wallet are still worth their face value and can be spent or used on anything you need, even if they don’t have a serial number the collectors are looking for. By simply scanning the serial numbers of all the bills you get throughout the year, you can likely make a bit of extra pocket money if you understand what the collectors are after. Below you’ll find 17 types of bills that are worth more than their face value to collectors, that are still regularly circulated.

    Low Numbers

    serial number 1 another bill worth more than face valueBy far, the most popular type of bill that collectors want are bills with low serial numbers. Any bill with a serial number under 100 will almost always at least double the value of the bill, and sometimes make it worth much more. Collectors estimate that new $100 bills with low numbers could be worth several thousand dollars, with the serial number 00000001 bill worth $15,000.

    Since bills are created at 12 different facilities (Atlanta, Boston, Chicago, Cleveland, Dallas, Kansas City, Minneapolis, New York City, Philadelphia, Richmond VA, St. Louis and San Francisco), there are 12 different bills with each of these numbers on them. Bills with numbers under 100 are highly sought, but collectors are still interested in numbers in the hundreds, and even into the thousands. The lower the number, the more valuable it becomes.

    High Numbers

    high serial number dollar billMuch like the low numbers, there are also people who like to collect the high number bills. While these aren’t as popular as low number bills, it can actually be more difficult to find them. That’s because not every series of bills will reach the high numbers before they are changed – there are fewer of them that ever make it into circulation. High number serial numbers such as 99999925 or 99999853 would be coveted by collectors. The higher the number, the more valuable it becomes.

    Star Notes

    star note serial number - for collectors worth more than face valueIn a perfect world, nothing would ever go wrong when printing money. Since we don’t live in a perfect world, issues do arise when bills are printed. When there is some type of printing error and bills need to be printed again, it is indicated by printing a star at the end of the bill’s serial number. Since printing errors don’t happen too often, notes with a star at the end of the serial number aren’t common, and this makes them sought after by collectors. These bills are officially known as “replacement notes,” but most collectors refer to them as “star bills” or “star notes.”

    Ladders

    Another type of bill that many collectors like to have as part of their collection are ladder bills. Ladder notes are those where the serial number ascends or descends in order. An example of an ascending ladder bill would be one with a serial number 01234567 and an example of a descending ladder note would be 98765432.

    Ladder notes are rare and thus, any you find would be worth much more than its face value to collectors. It’s also possible to have a note that has both ascending and descending numbers in the same note. While this isn’t a true ladder note, it is still considered part of the ladder family and there are people who collect them. An example of this would be 34565432

    Since ladder bills are so rare, people also collect “near ladder” notes. These are bills where the serial number is in a ladder sequence, but one or two aren’t. An example of this would be 51234567 or 98765430. These notes aren’t as valuable as ladder bills, but they are still worth more than the face value of the bill to collectors.

    Solids

    solid serial number billA solid note is one where the numbers are all the same for the serial number. An example of this would be a serial number of 22222222. Finding solid bills is quite rare and collectors would pay far more than face value for any that come available. Since solid notes are so rare, collectors also seek out near solid notes as well. These are bills that only have all the same number except for one digit. An example of this would be 77777797. With the near solid notes there are only two numbers in the serial number so all near solid notes are also binary notes.

    Repeaters

    super repeater serial number dollar billAnother serial number that often attracts collectors is one that repeats the numbers in the serial number. These bills are called repeating notes or repeater notes. For example, a repeater note would be something like 48648648 or 78937893. If you can find a repeating two number bill, that is called a super repeater and is highly sought after. An example of a super repeater would be 63636363. If you find any bill that has repeating numbers constituting the serial number, it will be worth more than face value to collectors.

    Binary & Trinary

    Binary bills are those notes which have a serial number that consist of only two numbers. An example of a binary note would be 66766676. The numbers can be in any order within the serial number, and as long as there are only two different numbers it is considered a binary note. Due to the difficulty of finding binary notes, there is also demand from collectors for bills which have three different numbers in any combination. These are referred to as trinary notes, and while they’re not as valuable as binary notes, they’ll still be worth more than their face value to collectors.

    True Binary

    true binary dollar billWhile binary bills are highly collectible, the best of the best are bills that have only ones and zeros as part of their serial number. When a bill only has ones and zeros, it is referred to as a true binary note. These notes can go for much more than other binary notes because in addition to bill collectors, you also have many computer enthusiasts who have interests in these bills. An example of a true binary would be 00011011.

    Birthday

    A lot of people who collect bills look for bills that have special meaning to them as individuals. One of the more popular types of bills for people to collect are what are referred to as birthday notes. These are bills which have a year written somewhere within the serial number. The year usually has some special significance to the person who wants the bill such as the year they were born, an anniversary year, or the year of some other type of personal event of significance to them.

    An example of a birthday note would be 65819770 where 1977 might be a significant year to someone. Another would be 00198500 where the year 1985 is significant. While the year can be anywhere within the serial number for it to be considered a birthday note, if the year comes at the very end of the serial number, or is preceded or surrounded by zeros on both sides, it is usually more desirable and therefore, more valuable to collectors.

    Full Date

    An even more valuable bill for collectors are full date notes. These bills have serial numbers that depict a full date rather than just a year. For example, if you were born on October 22, 1967, a full date note would read 10221967. Any note that depicts a date in full that corresponds with a special event for someone will be extremely valuable to that person, and collectors can pay quite a bit to get hold of a full date note that depicts something special for them.

    Radar

    super radar serial number dollar bill - bills worth than face valueRadar bills are much like the word “radar” itself – they are bills where the serial number will read the same backwards as it does forward, just as radar reads the same both backward and forward. An example of a radar note would be 03688630 or 96255269. The serial number is the same both ways. Radar notes that are all the same except for the two end numbers are referred to as super radars. An example of a super radar would be 38888883 and these are highly sought after by collectors.

    Doubles

    Currency collectors are often also interested in double notes. These are bills that have the same number pair next to each other within the serial number of the bill. The most valuable of the double notes are the ones that have four distinct pairs of numbers. These are called quad doubles. An example of a quad double serial number would be 44775511 or 99003366. While the quad doubles are the most sought after, tri doubles are also valued by collectors such as 27007711, but especially if they are framed by zeros such as 07744990.

    Double Quads

    double quad serial number dollar billAnother highly collectible bill are double quad notes. These are bills that have two sets of four of the same number. An example of this would be 44449999 or 66661111. While technically they are also a version of the quad doubles mentioned above, because they are significantly more difficult to find, they have their own name.

    Consecutive

    Consecutive notes are two (or more) bills where the serial numbers are consecutive in order. Examples of consecutive bills would be two bills in your hand with one having the serial number 97350342 and the other having 97350343. It’s actually quite easy to attain consecutive notes, as many banks have them if you get any bill denomination in a bundle of 100. Even with the ease of getting them, these are collectible and you can often get a bit more than face value for them in many instances. They become more of interest to collectors when they are consecutive and also possess one or more of the other traits mentioned in this article. For example, consecutive bills that are also a binary bills: 45554454 and 45554455.

    Bookends

    bookeend serial number dollar bill - bills worth more than face valueA bill’s serial number that has the same two or three numbers on each end is considered a bookend note by collectors. An example of this would be 20873420 or 34598345. Bookend notes having three numbers the same on each end are more valuable to collectors (and much more difficult to find), but even notes with two bookend numbers can fetch prices over the bill’s face value.

    Unusual Numbers

    Bank notes whose serial number matches well-known numbers also have appeal to collectors. A classic example would be a “pi” bill that had a serial number that corresponds to the first 8 digits of the numerical value of pi: 31415927. Any string of numbers that have a special meaning to someone or something will likely be coveted by some collector.

    Combinations

    While all of the above bills with serial numbers would likely find collectors willing to pay above face value for the bill, each gains a little more value if they are combinations of two or more of the above types of notes. While these are obviously more difficult to find than those that have just a single point of desire for collectors, combination notes also can be worth significantly more due to this rarity. One of many examples that exist would be a birthday/repeater combination which might look like 19771977.

    Bonus

    The reality is that if you can find something within a bill’s serial number that makes it unique, there is probably someone out there who will pay more than its face value to add it to their collection. Basically, if you look at a serial number and say to yourself, “Wow, that’s neat!” then collectors will likely feel the same way. Use the different types of bills that collectors look for mentioned above as a guide, but don’t limit yourself to them if you find an interesting serial number that isn’t mentioned.

    As with all things collectible, condition matters. The better the condition of the note, the more valuable it will be. That being said, unless the bill is extremely worn and ripped, any of the above-mentioned serial numbered bills will still be worth more than their face value even if the bill has been in circulation for a while. The goal is to find the bills in the best shape possible, but don’t be discouraged if you find one of the bills that shows a bit of wear.

    If you carry cash on a regular basis, a few of these notes likely pass through your hands during the year. Much like finding coins, if you simply look at the bills you have in your wallet after reading this article, you aren’t likely to find any of them. However, if you get into the habit of checking each bill that passes through your hands, you will eventually come across some that collectors desire.

    Increasing Your Chances

    If you are willing to take your search a step further, start withdrawing money from your bank from a teller always requesting new bills. If you do come across a bill that is collectible, it will be in better condition, making it worth more. It will also give you the chance to go back to the teller and get more bills if you get one you like with serials numbers close to any of the valuable series.

    If not, the crisp bills will help you save money. As mentioned previously, this can be a fun way to make a bit of extra money that doesn’t cost a cent, since all the money that you get is still worth its face value. There aren’t many fun hobbies that let you do that.

    Finally, the average lifespan of a dollar bill is between 22 and 89 months, so the chances of finding a rare or valuable bill goes down the longer the bill has been in circulation.

    Where To Learn More

    A good place to learn more about dollar bills worth more than face value is to hit the books. The go-to resource in this area is the Standard Guide to Small-Size U.S. Paper Money – 1928-Date (Standard Catalog). This resource is particularly useful for identifying which block letters and serial numbers are potentially valuable. You can pick up a used copy on Amazon.com for cheap – just five or six bucks.

    (Photos Credit: CoolSerialNumbers)

  • Maximize Your Credit Card Rewards

    Maximize Your Credit Card Rewards


    CardPointers

    Product Name: CardPointers

    Product Description: CardPointers is an app that helps you maximize the rewards you earn from your credit cards. Includes a browser extension (Chrome, Safari) that automatically adds special offers.

    About CardPointers

    CardPointers is an app that helps you maximize your credit card rewards by help you know which benefits are available from which card. It also has features to help you track limited time offers, automatically add offers to your card (Chase, Bank of America, Citi, AMEX), and more.

    Pros

    • Easy to setup, requires no sensitive information
    • Very easy to use, helps you remember which card to use
    • Automatically add limited time offers via extension
    • Tracking features help you maximize benefits

    Cons

    • Free version has limited functionality

    If you use just a couple of credit cards, it’s easy to remember the best one to use and when.

    But if you have more than a few, juggling them can be challenging. Also, as card benefits are constantly being added and removed, changing with limited time promotions, keeping track of what is best becomes even harder. Almost impossible.

    But there’s a tool that can help solve that problem.

    The one I like the most is CardPointers.

    Table of Contents
    1. What is CardPointers?
    2. How to Set up CardPointers
    3. Pointers Tab: Always Know The Best Card To Use
    4. Offers Tab: Lists All Limited Time Offers
    5. Chrome/Safari Extension: Activates Offers
    6. Special Offer: 30% Off
    7. Summary

    What is CardPointers?

    CardPointers is an app and browser extension that can help you optimize your credit card spending so you maximize their value. It will help you keep track of rewards and bonuses so you are always taking advantage of the best offers. It also helps you track benefits that may be limited on a monthly or annual basis, so you don’t have to remember yourself.

    For example, I have a Southwest Rapid Rewards Card that gets four Upgraded Boardings reimbursed each year. I know I’ve used two and have two left, but with CardPointers I can let it keep track so I don’t need to remember anything. I also have $75 in Southwest credit to use each year – something I definitely want to spend because it’s free money.

    That’s just one card. There are loads of benefits from all the other cards I have.

    Before I get to into the weeds on the features, here’s the pricing.

    • For free, CardPointers offers a small subset of their features so you can see what it can do – add one card, limited tracking of usage, but costs nothing. You can see how it can help without paying.
    • CardPointers+ is only $6 per month, or $72 per year, and you can track all of your credit cards, all of your spending and which card you should use, and a whole host of features I’ll share below.

    ⭐ First, check out what CardPointers can do and then we have a special offer (or click that link to jump down and see it) below for Best Wallet Hacks readers.

    How to Set up CardPointers

    The first step is to go to CardPointers.com and download the app for your device. They support Apple, Android, Chrome, and Firefox.

    Once you open you app, add all of the credit cards you use. You don’t need to know your credit card numbers, just the name of the card – like Chase Freedom, American Express Gold, etc.

    CardPointers keeps track of the cashback schedules, bonuses, cashback limits, and other details for you. They don’t need to know your actual credit card number and you never have to log into your bank. They support over 5,000 cards in the United States and Canada.

    📅 One nice feature is you can record the date your card was approved, so it can track when the annual fee will come due. This lets you call in for a retention offer or cancel the card.

    I found the tracking of monthly limits to be clever. You have to track this manually since they don’t record your specific card information:

    Pointers Tab: Always Know The Best Card To Use

    Once you’ve added all of your cards, the Pointers section shows you the best card to use in which category:

    No more guessing which card is best.

    If you are comfortable with CardPointers knowing where you are, you can use AutoPilot and it will recommend what card to use on your lock screen (you can turn it on and off) based on where you are standing. If you’re in a Target, it’ll recommend the best card for Target. You can toggle on and off AutoPilot from within the app so you’re not constantly messing with your Settings to turn it on and off.

    If you want to see something really cool, “Pointers in AR” is a feature that uses the camera and will scan the store to tell you which card to use. Seems a bit overkill but it’s cool.

    Offers Tab: Lists All Limited Time Offers

    The Offers Tab is great because it’ll track all of those special offers and lets you update the limits right on the screen:

    I find it really hard to remember these, especially the smaller ones like $10 here or there. We use Instacart and DoorDash on an irregular basis, I just don’t care enough to search for which card offers a $10 credit especially when I’m away from home or busy. But I’m willing to open up the app and find out in five seconds, it’s like leaning down to pick up a $10 bill – I’m doing it.

    But Offers is even better when you use the browser extension.

    Chrome/Safari Extension: Activates Offers

    My favorite feature is their browser extension (Chrome and Safari) called CardPointers X. It will “activate” all those special offers you see in your account. They support American Express, Chase, Bank of America, and Citi.

    You see how most of the offers have a blue circle with a plus sign inside of it? The blue arrow points to an offer that is available but not activated. If you click on the offer, it activates it and turns it until a green check box.

    For example, did you know that for a limited time, Chase will give you $250 if you spend $1,000 or more at Tonal. If you were going to be dropping a grand, wouldn’t you want to know about and, more importantly, activate this offer before your purchase?

    Honestly, I’d be furious if I made a purchase and missed out on $250 because I failed to “activate” this offer.

    CardPointers’ extension will just turn on all the offers for you.

    And now you can see they all have green checks:

    I don’t see why you wouldn’t want CardPointers to activate them all but if you want to do it manually, or pick and choose, you can do so too:

    Once you have all the offers added, you can go back to the offers tab to see them all. You can search, use the AutoPilot tool, and automatically know which card to use to take advantage of these offers, even the limited time ones.

    Finally, when you visit websites, there will be a small pop-up at the bottom of the page that tells you which of your cards is best – here it what is showed on Southwest.com:

    Special Offer: 30% Off

    We partnered with CardPointers to get you 30% off the regular price. You can get the annual subscription for just $50 (instead of $72) after a 7-day free trial.

    If you want to buy a lifetime subscription, that’s only $168 plus they give you a free $100 savings card you can use with one of their partners (I’d treat that as gravy if you can use it). Even the lifetime subscription of $168 is just over two years of fees.

    👉 Learn more about this offer

    Summary

    I don’t juggle half a dozen credit cards, we use just three on a daily basis (and even then, mostly two), but now that I have CardPointers, I’m going to add of my cards to see if I’m leaving some cash on the table.

    The biggest draw for me with CardPointers was the browser extension. I know that my Chase and American Express cards have these special offers (hundreds of them) but I have no interest in scanning page after page of offers on the off chance I might see something I can use. Plus, I don’t like the idea of an offer pushing me to spend, I’d rather let need dictate that and get the pleasant surprise of a discount.

    For $72 a year, I can make sure every offer is added and before major purchases, I’ll double check CardPointers to make sure I’m not missing an offer or favorable cashback offer.

  • 2025 2026 401k 403b 457 IRA FSA HSA Contribution Limits

    2025 2026 401k 403b 457 IRA FSA HSA Contribution Limits


    Retirement account contribution limits are adjusted for inflation each year. Most contribution limits and income limits are projected to go up in 2026.

    Before the IRS publishes the official adjustments for the next year in late October or early November, I calculate them based on the published inflation numbers by the same method the IRS uses, as stipulated by law. I’ve maintained a track record of 100% accuracy ever since I started doing these calculations.

    2025 2026 401k/403b/457/TSP Elective Deferral Limit

    The 401k/403b/457/TSP contribution limit is $23,500 in 2025. It will go up by $1,000 to $24,500 in 2026.

    If you are age 50 or over by December 31, the catch-up contribution limit is $7,500 in 2025. It will go up by $500 to $8,000 in 2026.

    If your age is 60 through 63 by December 31, you have a higher catch-up limit of $11,250 in 2025. It will go up by $250 to $11,500 in 2026.

    If your prior year’s wages from the employer were over $145,000, your 2025 catch-up contribution must go to a Roth subaccount in the plan. The threshold will go up by $5,000 to $150,000 in 2026. The IRS has postponed enforcing this rule for 2025, but it will start enforcing it in 2026.

    Employer match or profit-sharing contributions aren’t included in these limits. If you work for multiple employers in the same year or if your employer offers multiple plans, you have one single employee contribution limit for 401k, 403b, and the federal government’s Thrift Savings Plan (TSP) across all plans.

    The 457 plan limit is separate from the 401k/403b/TSP limit. You can contribute the maximum to both a 401k/403b/TSP plan and a 457 plan.

    2025 2026 Annual Additions Limit

    The limit on total contributions from both the employer and the employee to all defined contribution plans by the same employer is $70,000 in 2025. It will increase to $72,000 in 2026.

    The age-50-or-over catch-up contribution is separate from this limit. If you work for multiple employers in the same year, you have a separate annual additions limit for each unrelated employer.

    2025 2026 SEP-IRA Contribution Limit

    If you have self-employment income, you can contribute a percentage of your self-employment income to a SEP-IRA. The SEP-IRA contribution limit is always the same as the annual additions limit for a 401k plan. It’s $70,000 in 2025, and it will increase to $72,000 in 2026.

    Because the SEP-IRA doesn’t allow employee contributions, unless your self-employment income is well above $200,000, you have a higher contribution limit if you use a solo 401k. See Solo 401k When You Have Self-Employment Income.

    2025 2026 Annual Compensation Limit

    The maximum annual compensation that can be considered for making contributions to a retirement plan is always 5x the annual additions limit. Therefore the annual compensation limit is $350,000 in 2025. It will increase to $360,000 in 2026.

    2025 2026 Highly Compensated Employee Threshold

    If your employer limits your contribution because you’re a Highly Compensated Employee (HCE), the minimum compensation to be counted as an HCE is $160,000 in 2025. It will stay the same at $160,000 in 2026.

    2025 2026 SIMPLE 401k and SIMPLE IRA Contribution Limit

    Some smaller employers offer a SIMPLE 401k or a SIMPLE IRA plan instead of a regular 401k plan. SIMPLE 401k and SIMPLE IRA plans have a lower contribution limit than standard 401k plans. The contribution limit for SIMPLE 401k and SIMPLE IRA plans is $16,500 in 2025. It will go up to $17,000 in 2026.

    Employers with fewer than 25 employees and larger employers that contribute more to the plan have a higher contribution limit. The regular contribution limit to their SIMPLE plans is $17,600 in 2025. It will go up to $18,500 in 2026.

    If you are 50 or over by December 31, the catch-up contribution limit in a SIMPLE 401k or SIMPLE IRA plan is $3,500 in 2025 ($3,850 at smaller employers) for ages 50-59 and 64 and over, and $5,250 for ages 60 through 63. It will be $4,000 in 2026 for ages 50-59 and 64 and over, and $5,000 for ages 60 through 63. The IRS may keep the catch-up limit for ages 60 through 63 at $5,250 in 2026.

    Employer contributions to a SIMPLE 401k or SIMPLE IRA plan aren’t included in these limits.

    2025 2026 Traditional and Roth IRA Contribution Limit

    You need taxable compensation (“earned income”) to contribute to a Traditional or Roth IRA but there’s no age limit. The Traditional IRA or Roth IRA contribution limit is $7,000 in 2025. It will increase by $500 to $7,500 in 2026.

    If you are age 50 or over by December 31, the catch-up limit is $1,000 in 2025. It will increase by $100 to $1,100 in 2026.

    The IRA contribution limit is shared between the Traditional IRA and the Roth IRA. If you contribute the maximum to a Roth IRA, you can’t contribute the same maximum again to a Traditional IRA, and vice versa.

    The IRA contribution limit and the 401k/403b/TSP or SIMPLE contribution limit are separate. You can contribute the respective maximum to both a 401k/403b/TSP/SIMPLE plan and a Traditional IRA or Roth IRA.

    2025 2026 Deductible IRA Income Limit

    The income limit for taking a full deduction for your contribution to a Traditional IRA while participating in a workplace retirement plan in 2025 is $79,000 for single filers and $126,000 for a married couple filing jointly. The deduction completely phases out when your income goes above $89,000 for singles and $146,000 for married filing jointly.

    The full-deduction income limits will go up in 2026 to $81,000 for single filers and to $129,000 for a married couple filing jointly. The deduction will completely phase out when your income goes above $91,000 for singles and $149,000 for married filing jointly.

    When you’re not covered in a workplace retirement plan but your spouse is, the income limit for taking a full deduction for your contribution to a Traditional IRA is $236,000 in 2025. The deduction completely phases out when your joint income goes above $246,000.

    The full-deduction income limit will go up to $242,000 in 2026. The deduction completely phases out when your joint income goes above $252,000.

    There’s no income limit if neither you nor your spouse is covered by a workplace retirement plan.

    When you exceed the income limit for taking a deduction for contributing to a Traditional IRA, consider contributing to a Roth IRA instead.

    2025 2026 Roth IRA Income Limit

    The income limit for contributing the maximum to a Roth IRA depends on your filing status. The income limit in 2025 is $150,000 for singles and $236,000 for married filing jointly. These limits will go up to $153,000 for singles and $242,000 for married filing jointly in 2026.

    You can’t contribute anything directly to a Roth IRA when your income goes above $165,000 in 2025 for singles and $246,000 for married filing jointly. These income limits will go up to $168,000 for singles and $252,000 for married filing jointly in 2026.

    Your contribution eligibility is prorated in the income phase-out range. When you exceed the income limit for contributing to a Roth IRA, consider doing the backdoor Roth. See Backdoor Roth: A Complete How-To.

    2025 2026 Healthcare FSA Contribution Limit

    The Healthcare FSA contribution limit is $3,300 per person in 2025. It will go up to $3,400 in 2026.

    Some employers allow carrying over some unused amount to the following year. The maximum amount that can be carried over to the following year is set to 20% of the contribution limit in the current tax year. As a result, the carryover limit is $660 per person in 2025. It will go up to $680 in 2026.

    2025 2026 HSA Contribution Limit

    You need to have a High Deductible Health Plan with no other coverage to contribute to a Health Savings Account (HSA). Not all high-deductible health insurance is HSA-eligible, but the 2025 Trump tax law made all Bronze plans from an ACA marketplace HSA-eligible starting in 2026.

    Medicare or your spouse having a general-purpose healthcare FSA counts as having other coverage, which makes you ineligible to contribute to an HSA.

    You don’t need taxable compensation (“earned income”) to contribute to an HSA.

    The HSA contribution limit in 2025 is $4,300 for single coverage and $8,550 for family coverage. These limits will go up in 2026 to $4,400 for single coverage and $8,750 for family coverage. The new limits were announced previously in the spring. See HSA Contribution Limits.

    Those who are 55 or older by December 31 can contribute an additional $1,000. If you are married and both of you are 55 or older by December 31, each of you can contribute the additional $1,000, but the contributions must go into separate HSAs in each person’s name.

    2025 2026 Saver’s Credit Income Limit

    You may be eligible to receive a Retirement Savings Contributions Credit (“Saver’s Credit”) of up to $2,000 per person when you contribute to a retirement account or an ABLE account.

    The income limits for receiving the credit in 2025 for married filing jointly are $47,500 (50% credit), $51,000 (20% credit), and $79,000 (10% credit). These limits will go up in 2026 to $48,500 (50% credit), $52,500 (20% credit), and $80,500 (10% credit).

    The limits for singles are half of the limits for married filing jointly. The 2025 limits are $23,750 (50% credit), $25,500 (20% credit), and $39,500 (10% credit). The 2026 limits will be $24,250 (50% credit), $26,250 (20% credit), and $40,250 (10% credit).

    The 2025 Trump tax law reduced the scope of the Saver’s Credit. It will apply only when you contribute to an ABLE account starting in 2027. Contributions to retirement accounts will no longer qualify after 2026.

    All Together

    2025 2026 (Projected) Increase
    401k, 403b, or 457 plan employee contributions limit $23,500 $24,500 $1,000
    401k, 403b, or 457 plan ages 50-59 and 64+ catch-up contributions limit $7,500 $8,000 $500
    401k, 403b, or 457 plan ages 60-63 catch-up contributions limit $11,250 $11,500 $250
    SIMPLE plan contributions limit $16,500 $17,000 $500
    SIMPLE plan contributions limit at eligible employers $17,600 $18,500 $900
    SIMPLE plan ages 50-59 and 64+ catch-up contributions limit $3,500 $4,000 $500
    SIMPLE plan ages 50-59 and 64+ catch-up contributions limit at eligible employers $3,850 $4,000 $150
    SIMPLE plan ages 60-63 catch-up contributions limit $5,250 $5,000 or $5,250 -$250 or None
    Maximum annual additions to all defined contribution plans by the same employer $70,000 $72,000 $2,000
    SEP-IRA contribution limit $70,000 $72,000 $2,000
    Highly Compensated Employee definition $160,000 $160,000 None
    Annual Compensation Limit $350,000 $360,000 $10,000
    Traditional and Roth IRA contribution limit $7,000 $7,500 $500
    Traditional and Roth IRA age 50+ catch-up contribution limit $1,000 $1,100 $100
    Deductible IRA income limit, single, active participant in a workplace retirement plan $79,000 – $89,000 $81,000 – $91,000 $2,000
    Deductible IRA income limit, married, active participant in a workplace retirement plan $126,000 – $146,000 $129,000 – $149,000 $3,000
    Deductible IRA income limit, married, spouse is an active participant in a workplace retirement plan $236,000 – $246,000 $242,000 – $252,000 $6,000
    Roth IRA income limit, single $150,000 – $165,000 $153,000 – $168,000 $3,000
    Roth IRA income limit, married filing jointly $236,000 – $246,000 $242,000 – $252,000 $6,000
    Healthcare FSA Contribution Limit $3,300 $3,400 $100
    HSA Contribution Limit, single coverage $4,300 $4,400 $100
    HSA Contribution Limit, family coverage $8,550 $8,750 $200
    HSA, age 55 catch-up $1,000 $1,000 None
    Saver’s Credit income limit, married filing jointly $47,500 (50%)
    $51,000 (20%)
    $79,000 (10%)
    $48,500 (50%)
    $52,500 (20%)
    $80,500 (10%)
    $1,000 (50%)
    $1,500 (20%)
    $1,500 (10%)
    Saver’s Credit income limit, single $23,750 (50%)
    $25,500 (20%)
    $39,500 (10%)
    $24,250 (50%)
    $26,250 (20%)
    $40,250 (10%)
    $500 (50%)
    $750 (20%)
    $750 (10%)

    Source: IRS Notice 2024-80, author’s calculations.

    2025 2026 Tax Brackets and Standard Deduction

    I also calculated the 2026 income tax brackets, standard deduction, capital gains tax brackets, and the gift tax exclusion limit. Please read 2026 Tax Brackets, Standard Deduction, Capital Gains, etc.

    Say No To Management Fees

    If you are paying an advisor a percentage of your assets, you are paying 5-10x too much. Learn how to find an independent advisor, pay for advice, and only the advice.

    Find Advice-Only

  • Stop Waiting for Dips: Smart Investment Planning

    Stop Waiting for Dips: Smart Investment Planning


    Many investors dream of catching the market at just the right moment — buying when prices are low, selling when they’re high, and repeating the process like clockwork. In theory, it sounds flawless. In reality, it’s a dangerous illusion that can sabotage your investment planning and cost you years of potential growth.

    The quest for “perfect timing” has turned into what we at Fincart call the correction obsession — an all-too-common habit where investors freeze, waiting endlessly for the “right” entry point, while their money sits idle.

    The Correction Obsession – A Modern Investing Ailment

    Every small dip in the market sets off a chain reaction — breaking news flashes on television, push notifications from financial apps, urgent analysis videos on YouTube, and endless opinion threads on social media. For investors, this constant noise creates the illusion that a major opportunity or threat is always just around the corner.

    Over time, this fuels a behavioural trap that quietly sabotages even the best investment planning. It shows up in three common patterns:

    1. The Perpetual Waiter

    This investor is convinced the market is “too high right now” and that a better entry point is just weeks or months away. They hold cash for long periods, waiting for a correction that may or may not come.

    • Example: They might have avoided investing since the index crossed a “psychological threshold” years ago, certain that a crash was imminent.
    • Psychology at play: Loss aversion — the fear of losing money is stronger than the desire to gain it, so they’d rather do nothing than risk a perceived overvaluation. Anchoring bias also plays a role — they fixate on a past lower price and refuse to invest above it.
    • The cost: While they wait, inflation eats into their purchasing power and compounding opportunities slip away forever.

    2. The Prediction Chaser

    These investors spend hours tracking forecasts, technical indicators, and expert commentary, trying to “call” the next correction. Their confidence rises with each analysis they consume, but the volume of conflicting opinions leads to decision fatigue.

    • Example: One week they expect a global event to spark a sell-off; the next week they believe a domestic policy change will trigger it. By the time they make a move, the market has already shifted.
    • Psychology at play: Overconfidence bias — believing that more information automatically means better predictions. Confirmation bias — seeking only the news that supports their belief about an upcoming correction.
    • The cost: They become trapped in analysis paralysis, endlessly gathering data instead of putting their money to work.

    3. The Bottom Hunter

    These investors think the only smart way to enter the market is at its absolute lowest point. They watch prices fall, waiting for that magical moment — but since bottoms are visible only in hindsight, they often end up missing the recovery entirely.

    • Example: During a 15% decline, they tell themselves they’ll invest if it drops another 5%. The market rebounds instead, and they’re left watching gains pass them by.
    • Psychology at play: Greed disguised as caution — wanting the maximum gain for the minimum risk. Also, recency bias — assuming that because prices are falling now, they will keep falling until they hit a clear bottom.
    • The cost: They miss the early recovery phase, which often delivers the strongest returns in the shortest time.

    Whether it’s waiting endlessly, chasing predictions, or hunting for the absolute bottom, these patterns share the same flaw — they prioritise perfect timing over consistent progress. 

    In reality, no one can consistently predict short-term market moves. The real opportunity isn’t in guessing the next dip, but in steadily building and holding a well-planned portfolio through market ups and downs.

    The Real Cost of Waiting

    When you delay investing, you’re not just missing the returns you could be earning right now — you’re also losing the future returns those missed gains could have generated through compounding. 

    This “opportunity cost” is invisible in the short term, but over years and decades, it can create a significant gap in your wealth.

    Consider this:

    • Missed compounding snowballs into a permanent shortfall
      Let’s say you have ₹10 lakh to invest, but you wait six months for a “better” entry point. If the market rises 8% during that time, you miss ₹80,000 in gains. Over 20 years, assuming 10% annual growth, that ₹80,000 could have grown into over ₹5 lakh — money you can never fully recover because compounding needs time to work its magic.
    • Inflation quietly erodes your purchasing power
      Even when markets are volatile, inflation doesn’t take a break. At a 5% inflation rate, the ₹10 lakh you keep in cash loses ₹50,000 in real value over a year. So, while you wait for “ideal” market conditions, the real worth of your money is shrinking.
    • Short delays can create big lifetime gaps
      In investment planning, the difference between starting today and starting just five years later can mean retiring with 30–40% less wealth — not because you invested less, but because you gave compounding fewer years to multiply your money.

    The truth is, lost time is lost growth. No amount of “perfect timing” later can fully compensate for the months or years your money spent sitting idle. The earlier you start and the more consistently you invest, the greater the compounding effect — and the more resilient your portfolio becomes to short-term market swings.

    Why Timing Rarely Works

    Markets don’t operate on a predictable schedule. Corrections are natural, but their timing, depth, and recovery speed are unpredictable. Even professional fund managers rarely get timing consistently right.

    Trying to “call” the market:

    • Involves constant monitoring, which fuels stress and anxiety.
    • Often leads to selling during panic and buying during euphoria — the exact opposite of what works.
    • Turns investing into a speculative game instead of a strategic wealth-building plan.

    Time in the Market > Timing the Market

    The most reliable driver of long-term returns isn’t market timing — it’s time spent invested. Staying consistently invested allows you to capture entire market cycles, not just short-term swings.

    Here’s the reality:

    • Missing just a handful of the best days in the market over a decade can drastically reduce your total returns.
    • Regular, disciplined investing (regardless of market conditions) smooths out volatility over time.

    This is why systematic investment planning, like SIPs in mutual funds, is so powerful — it removes the need to guess the “right” time and focuses on steady, compounding growth.

    What Smart Investors Do Differently

    While many investors get caught in the trap of obsessing over market corrections, successful investors take a completely different approach. Their focus isn’t on predicting the next dip or peak — it’s on building and protecting wealth over the long term through disciplined investment planning.

    Here’s how they do it:

    1. Set Clear Goals

    Every smart investor starts with a destination in mind. They know whether they’re investing for retirement, their child’s education, buying a home, or simply building long-term wealth.

    • Why it matters: Without clear goals, investment decisions tend to be reactive — driven by market movements instead of personal needs. A defined goal allows you to select the right asset mix, investment horizon, and contribution schedule.
    • Example: A retirement goal 25 years away may justify a higher equity allocation, while a goal in 5 years may need a more balanced, conservative portfolio.

    2. Stay Disciplined

    They invest regularly, even when markets are volatile. Instead of trying to guess “when” to enter, they stick to their plan through ups and downs.

    • Why it matters: Volatility is temporary; compounding is permanent. Regular contributions ensure you benefit from rupee cost averaging, buying more units when prices are low and fewer when prices are high.
    • Example: Continuing SIPs during a market dip can accelerate long-term returns because you’re buying quality assets at lower valuations.

    3. Diversify Smartly

    Smart investors spread their investments across asset classes (equity, debt, gold, etc.) and sectors, reducing the risk of being overexposed to one area.

    • Why it matters: Diversification cushions your portfolio against sharp declines in any single asset. It’s not about avoiding losses entirely but about keeping them manageable so your plan stays on track.
    • Example: A well-diversified portfolio might have equity for growth, debt for stability, and gold for a hedge against inflation or currency risk.

    4. Ignore the Noise

    Markets generate endless commentary — much of it speculative and emotionally charged. Successful investors learn to filter out predictions, sensational headlines, and short-term hype.

    • Why it matters: Acting on market chatter often leads to buying high and selling low. Sticking to fundamentals and long-term data produces more consistent results.
    • Example: Instead of reacting to every piece of news about interest rate changes, they focus on their asset allocation and time horizon, making adjustments only when their life circumstances or goals change.

    By following these principles, smart investors avoid the pitfalls of correction obsession. They understand that success isn’t about perfect timing — it’s about consistent execution of a sound investment plan.

    How Fincart Helps You Overcome the Correction Obsession

    At Fincart, we believe investment planning should be driven by your goals, not market gossip. Our advisors help you:

    • Create a personalised investment plan aligned with your risk profile and timeline.
    • Implement systematic investing strategies that build wealth without relying on market timing.
    • Stay on track through market ups and downs with regular reviews and unbiased guidance.

    By shifting your focus from “when” to invest to “how” and “why” to invest, we help you achieve consistency — the real secret to long-term wealth creation.

    The Boring Truth That Works

    The markets will always rise and fall. Corrections will come and go. But wealth is built not by guessing the next move — it’s built by staying committed to your investment planning, investing regularly, and letting time and compounding do the heavy lifting.

    The perfect moment isn’t some future date after the “next” correction. It’s today.

    Loans Made Simple — With Fincart

    Fast Approval • Low Interest • Trusted Advice

    Our Key Offerings:

    • Mortgage Loans
        - Home Loan – Make your dream home a reality
        - Loan Against Property (LAP) – Access funds from your property
    • Personal Loan – For every need, big or small

    Also Available:

    • Education Loan | Auto Loan

    Call Now: [Phone Number]
    www.fincart.com

    Fincart – Your Trusted Financial Partner