
If you’ve ever stared at a high bounce rate and thought, what happened here?
Same.
I’ve spent years trying to decode analytics dashboards, looking for clues on where users drop off and why. But even the best metrics leave out a critical piece: the actual experience behind the numbers.
That’s what got me into searching for the best session replay software solutions. I wanted to see what users were doing, not just guess based on charts and funnels. After evaluating several tools and analysing them based on G2 user feedback, I’ve landed on seven session replay tools that really stand out.
If you’re trying to get closer to your users and make smarter user experience (UX) or conversion rate optimization decisions, this guide is for you. In this roundup, I focus on the most popular user session replay software used by modern product and growth teams — tools that surface real behavior, not just vanity metrics.
TL;DR:
- Top product picks: Based on G2 scores and personal testing, my top picks include LogRocket, Fullstory, and Clarity — each one a recommended session recording app for improving your user interface across teams and use cases.
- Key features: The best software for recording and replaying user sessions on desktop and mobile offers heatmaps, error logs, and high-quality replays to help decode drop-offs and optimize journeys.
- Common use cases: Whether you’re a SaaS founder, a UX analyst, or run a medium-sized ecommerce site looking for affordable session replay services, these tools help reveal how users actually experience your site.
Whether you’re looking for the best software for recording and replaying user sessions on desktop and mobile, this list highlights tools that deliver smooth cross-device insights.
7 best session replay software for 2025: My top picks
-
LogRocket: Best for pinpointing UX issues fast
Combines session replay, error tracking, front-end performance, and product analytics so teams can prioritize fixes. (Starting at $69/month) -
Fullstory: Best for deep behavioral analytics at scale
Auto-captures events, funnels, and heatmaps to reveal drop-offs, quantify impact, and guide roadmap decisions. (Available on request) -
Glassbox: Best for revenue-focused digital experience analytics
Maps journeys across web and mobile, detects struggle signals, and ties insights to engagement and conversion to drive loyalty. (Available on request) -
Dynatrace: Best for AI-powered full-stack monitoring with UX context
Links traces, logs, and metrics with real user sessions; Davis AI surfaces root causes and performance risks. (Available on request) -
Clarity: Best for free session recordings and heatmaps
Offers easy replays, rage-click detection, and simple filters in a lightweight, zero-cost tool that’s friendly for marketers and PMs alike. (Free forever) -
Contentsquare: Best for enterprise-grade journey insights and growth
Delivers zone-based heatmaps, journey and impact analysis, and quantified opportunity sizing to prioritize UX improvements. (Starting at $40/month) -
PostHog: Best for product analytics built for engineers
All-in-one funnels, cohorts, feature flags, and session replays — deploy cloud or self-hosted, with generous free usage to start. (First 5k recordings are free)
These best session replay software tools are top-rated in their category, according to G2 Grid Reports. I’ve also added their monthly pricing to make comparisons easier for you.
7 best session replay software I’d recommend
These picks reflect both expert opinions on the best session replay software and what teams actually adopt at scale. Understanding your users shouldn’t feel like guesswork, but without the right tools, it often does. If you’ve ever stared at analytics wondering why users drop off, rage-click, or abandon a form halfway through, you’re not alone.
That’s where session replay software comes in. Industry outlook backs this up: the session replay software market is projected to grow from about $463.7M in 2025 to roughly $1.7B by 2035, reflecting rapid adoption across product, UX, and engineering teams. These tools let you watch real user sessions. Every scroll, click, and hesitation so you can pinpoint friction, uncover hidden bugs, and improve your site’s UX with confidence.
After evaluating several platforms, I’ve narrowed it down to seven session replay tools that stood out to me either for their ease of use, advanced filtering, privacy features, or seamless integrations. Each one has its strengths, and depending on your needs, one might just be the game-changer you’ve been looking for.
If you’re running a small or non-technical team, there are also easy-to-use session replay tools for non-tech businesses that don’t require code knowledge to set up or use.
Let’s dive into the ones I’d actually recommend.
How did I find and evaluate these top session replay software?
I spent weeks evaluating session replay software, narrowing down the best options based on features, ease of use, pricing, and real user feedback. I also used AI-driven research to analyze software updates, marketer preferences, and common challenges to ensure these recommendations are as accurate and helpful as possible.
I also looked into which session replay software is most reliable for app developers, with special attention to tools that offer debugging logs, crash insights, and mobile SDK support.
In cases where I couldn’t personally test a tool due to limited access, I consulted a professional with hands-on experience and validated their insights using verified G2 reviews. The screenshots featured in this article may be a mix of those captured during testing and ones obtained from the vendor’s G2 page.
My research and analysis are also based on real-time buyer sentiments and the proprietary G2 scores each session replay software offers. I reviewed expert opinions on the best session replay software, pulling verified insights from developers, product managers, and UX analysts featured on G2.
What makes the best session replay software worth it: My perspective
As I evaluated different session replay tools, I realized that watching user behavior in real time is powerful. Some platforms gave me crystal-clear insights, while others left me with more questions than answers.
I realized that the best session replay software isn’t just about recording sessions. It’s about helping you understand them. Here are the features I paid close attention to while evaluating these tools:
- High-quality, smooth replays: There’s nothing worse than choppy, laggy replays that make it hard to follow what the user’s actually doing. I look for tools that offer smooth, high-resolution recordings that clearly show mouse movement, clicks, scrolls, and interactions with forms or dynamic elements. If I have to guess what happened, the replay’s not doing its job.
- Advanced filtering and segmentation: When you have hundreds (or thousands) of sessions to sift through, filters are a lifesaver. I rely on filters to surface sessions that actually matter. Rage clicks, exit pages, device types, traffic source, country, you name it. Being able to segment users based on behavior helped me zero in on friction points faster.
- Error tracking and console logs: This one’s especially helpful for collaboration with developers. Some tools log JavaScript errors and failed API calls directly within the session playback. I found this super useful when trying to understand where things went wrong on a page. No need to dig through dev tools or guess what caused the issue.
- Event tracking and heatmaps: Session replays are great, but I like when tools also provide click maps, scroll maps, and attention heatmaps. These give me a macro view of what users are doing across a page, so I can combine that with the micro-level insights from replays for a more complete picture. This macro view is why I consider heatmaps and journey maps essential in choosing a top session replay platform for analyzing customer behavior on my website.
- User journey mapping and funnels: Some tools let you see how users move from one page or action to the next. I found this incredibly helpful for identifying where people drop off or get stuck. Tools that visualize funnels alongside replays made it easier to spot patterns and optimize the entire user flow, not just individual pages. These features made certain platforms stand out as recommended session recording apps for improving my user interface, especially for diagnosing drop-offs in form flows or navigation.
- Lightweight script and performance impact: If a tool slows down your site, that’s a dealbreaker. I kept an eye on script weight and load time. The best ones run in the background without affecting the user experience or page speed.
Over the span of several weeks, I researched close to 25+ session replay software. I narrowed down the best seven based on their features and ease of use.
These aren’t just hidden gems, they’re some of the most popular user session replay software options available today, ranked highly for usability and insight depth.
To be included in this category, a solution must:
- Visually record and store user interactions on a designated website or mobile app
- Offer tools to analyze a user’s experience
- Provide insights into the general experience of users interacting with a website, mobile app, or digital product
- Assist in optimizing a user’s or client’s experience on a website or mobile app
*This data was pulled from G2 in 2025. Some reviews may have been edited for clarity.
1. LogRocket: Best for pinpointing UX issues fast
When it comes to debugging and understanding how users interact with an app, LogRocket is one of the tools users lean on the most. Rated 4.6/5 on G2, LogRocket pairs session replays — endorsed by 94% of reviewers — with built-in console/network capture to help teams diagnose issues faster.
The session replay feature is a total game changer. Being able to actually see what the user did, click by click, scroll by scroll, takes so much of the guesswork out of troubleshooting. It’s saves time so you don’t end up chasing vague bug reports more times than one can count.
Setup was surprisingly smooth. I saw users state that they didn’t have to jump through hoops to get it working, and the interface is intuitive enough that they could just dive in and start exploring sessions right away. It’s built in a way that makes sense, especially if you’ve ever wrestled with clunky analytics tools.

What really stands out is how much detail it captures. From network requests and console logs to Redux state and JavaScript errors, everything is neatly tied to the exact moment it happened in the session. That context makes finding and fixing issues way faster.
Honestly, according to G2 reviews, it’s saved users hours of back-and-forth with users or quality assurance (QA) teams. Instead of asking “what exactly happened?”, they can pull up a session and know immediately.
Teams love how session replays line up with console logs, network calls, and state changes — so engineers, PMs, and designers can move from “what happened?” to “fixed” much faster.
G2 user feedback does flag a few rough edges. Pricing can feel tight for startups; search/filtering works but isn’t always intuitive at high volume; and the UI can feel dense when you’re scanning lots of sessions. A small subset also notes occasional slower loads on long replays — manageable, but worth knowing as traffic scales.
Even with those caveats, G2 review data consistently frames LogRocket as a dependable, insight-rich tool. If you budget appropriately and give your team a quick orientation on filters and views, you get a powerful, reliable way to spot friction, prioritize fixes, and keep the user experience moving in the right direction.
What I like about LogRocket:
- The fact that I can view console logs, network activity, Redux state, and even JavaScript errors within each session is a huge plus. It cuts down on back-and-forth and helps me pinpoint bugs way faster.
- I really like the filtering options. It’s super helpful to quickly zero in on specific sessions or issues without digging through endless data.
What G2 users like about LogRocket:
“It’s like we are sitting with customer looking at their journey. We had a client with school 800 websites in US and logrocket helped us optimize our stores according to customer interactions with our websites. We daily check error pages, warnings and especially if some customers facing difficulty ordering products. Also it’s very easy to integrate and implement customer logs with names/emails. We use it regularly.”
– LogRocket Review, Zaheer A.
What I dislike about LogRocket:
- The UI is somewhat complex, and it often took users considerable time to figure out how to create the queries or graphs needed.
- One challenge is that finding user sessions can be difficult since searches are based on user email rather than more flexible filtering options.
What G2 users dislike about LogRocket:
“For our company, we dislike the fact that video recorded sessions are only available for 90 days. A lot of the times, we don’t tend to see an issue until we detect a pattern a few months after a feature has been launched but at that point, we can’t see the recorded videos.”
– LogRocket Review, Derek P.
Heatmaps show where users click, session replays show why. Check out the top heatmap tools to get a complete the picture.
2. Fullstory: Best for deep behavioral analytics at scale
Fullstory can shift teams from guessing about user issues to observing them in real time. Session replays capture scrolls, clicks, rage-clicks, hovers, and more, providing a clear picture of how users actually experience a site, not just what they clicked, but how they interacted.
For engineering collaboration, Fullstory also surfaces console logs and network requests alongside each replay. When a 500 error occurs or a button fails silently, the related API call and technical context appear within the session, reducing the need to dig through logs or piece together hypotheses.

Setup was honestly painless. Users mentioned they deployed it via Google Tag Manager, and didn’t need weeks to get started. The interface is clean and intuitive. Even non-technical teammates in product and customer support use it without any hand-holding. It’s become a shared tool across organizations.
It’s also killer for debugging and support. When a user reports a weird bug, it’s possible to find their session, see exactly what they saw, and either replicate the issue or show the devs what went wrong. It saves a ton of time.
Fullstory’s heatmaps, scroll maps, and funnels help pinpoint drop-offs and stuck points, making it easier to validate A/B tests and refine user flows. Teams often make targeted adjustments—like headline or CTA changes—based on these visual insights and see measurable conversion lifts.
Support is frequently noted as responsive and helpful, from implementing custom events to configuring field masking or diagnosing missed captures, providing practical guidance that shortens time to value.
Insights from G2 reviewers, plus hands-on use, surface a few watch-outs to plan for. Pricing can tighten as session volume grows, and a session-based model can feel tough during traffic spikes; some buyers also recommend double-checking renewal terms to avoid surprises. Beyond the basics, there’s a learning curve for advanced work — building complex metrics, dashboards, or nuanced segments takes time — and while filtering is powerful, suggestive search isn’t always spot-on.
Reporting/exporting to tools like Power BI or Excel could be smoother, and native visualizations feel more utilitarian than customizable. If you’re running headless setups or need deep, bespoke integrations, expect extra implementation effort; a few users note API limits in certain edge cases. On mobile, the SDK is solid, but teams working with Kotlin Multiplatform/Compose UI still want fuller recording support.
Even with those caveats, G2 reviews describe Fullstory as a high-impact choice for understanding digital behavior at scale. If you budget for volume, set clear export/BI workflows, and give power users a bit of enablement, you get a platform that consistently reveals friction, informs A/B ideas, and shortens the path from signal to shipped improvements.
What I like about Fullstory:
- The customer support team? Amazing. Every time I’ve hit a wall, they’ve been there to help. They’re quick, they actually listen, and they take feedback and turn it into product improvements.
- I love that I can not only replay sessions but also dig into the data. Build metrics, segment users, and spot patterns in behavior. It’s one of the tools I rely on every week.
What G2 users like about Fullstory:
“Fullstory has become an essential tool for our team at Autodesk, spanning Product Managers, Designers, Analysts, and Engineers. It’s been particularly impactful in diagnosing customer issues during new product launches, allowing us to ‘walk in our customer’s shoes.
The ability to see user sessions firsthand has significantly improved our understanding of friction points and identified key areas for improvement. We’ve quickly pinpointed and addressed issues, leading to smoother user experiences. Additionally, we’re incredibly fortunate to have exceptional support from our enablement team of Jasmine and Liz. Highly recommend Fullstory for anyone looking to gain deep insights into user behavior and optimize their digital experience.”
– Fullstory Review, Ryan G.
What I dislike about Fullstory:
- Users stated that it required multiple training sessions to get comfortable; the platform is powerful, but unlocking its full capabilities takes effort.
- At times, progress stalled without technical support, especially for tagging, building funnels, or setting up integrations.
What G2 users dislike about Fullstory:
“A bit difficult to level up beyond the introductory level. The training modules cover the basics and they’ve recently started a community space, but there’s not a ton on it yet. More advanced trainings would be appreciated to make sure we know how to get the most out of the tool.”
– Fullstory Review, Marley D.
Turn insights from session replays into real experiments with A/B testing tools to start optimizing your UX with data-driven decisions.
3. Glassbox: Best for revenue-focused digital experience analytics
Using Glassbox feels like having superpowers when it comes to understanding how users interact with our site. It holds a strong 4.9/5 rating on G2 and highlights features lreal-time reporting and segmentation, useful for tying replays to funnels and spotting drop-offs fast.
The platform feels easy and intuitive from the start, no lengthy manuals or hours of onboarding required. The UI is clean, responsive, and uncluttered. That said, mastering advanced filters takes a bit of digging, and more built-in training or guided walkthroughs would help. Once past that initial curve, it clicks.

What really stands out is the session replay. Teams can jump into any user journey, see exactly what the visitor saw, and retrace each step. The added context from detailed session data, API responses, device and browser information, and crash logs, turns troubleshooting into true narrative understanding; it’s not just fixing bugs, it’s grasping the full story behind them.
The AI assistant (GIA) adds another layer of utility. It can quickly summarize sessions or surface common threads across multiple user issues, saving significant time when pattern-finding or making sense of complex journeys. Interaction maps visualize hotspots and friction without manual tagging, and features like struggle scores and fraud indicators help surface problems, and risks, teams didn’t even know existed.
G2 customer reviews often highlight Glassbox for bringing the “why” behind metrics into focus — high-fidelity session replays, journey mapping, and struggle detection help teams tie UX fixes to measurable business impact.
Insights from G2 reviewers note a few areas to refine: session retention windows can feel short when you’re diagnosing long-running issues, and occasional performance slowdowns mean some replays take a moment to load. On the UX side, several users would welcome extra polish in filtering and search to speed up investigation.
Even so, G2 review data consistently frames Glassbox as a strong choice for revenue-focused digital experience analytics. With a clear plan for retention needs and a few workflow tweaks, teams get rich behavioral context that accelerates troubleshooting and optimization.
What I like about Glassbox:
- I love how detailed the session replays are. I can see exactly what users did, which buttons they clicked, and even where they dropped off. It’s like shadowing them in real-time.
- The platform shows me backend details like API call failures, not just the front-end actions. That’s a huge win when I’m debugging complex issues.
What G2 users like about Glassbox:
“Glassbox provides very useful insights on how are new product features are performing in the market when deployed to Prod. We use Glassbox to check if there are any issues encountered and/or how these new product features are performing in terms of Customer experience. It helps us to analyze and determine possible improvements usability and technically. Glassbox also helps us potential issues that Customer s might encounter based on evaluation and assessment of the App features.”
– Glassbox Review, Ronaldo O.
What I dislike about Glassbox:
- Currently can only look back for last 30 days records, it would be good to look bit more far in the history as sometimes have to refer for old sessions.
- The system response rate can be slow slows sometimes and you need tech knowledge in order to get results.
What G2 users dislike about Glassbox:
“I would like the option to save a session past its retention date.”
– Glassbox Review, verified user.
4. Dynatrace: Best for AI-powered full-stack monitoring with UX context
Dynatrace feels plugging into a control center one didn’t know was needed. Installation was quick and smooth. Dynatrace holds a 4.5/5 on G2, and 94% G2 users rate its performance monitoring highly and 80% rate its root cause analysis highly — a combo that underscores why teams lean on it to spot issues quickly and understand the why behind them.
With OneAgent deployed, Dynatrace immediately begins discovering services, applications, and underlying infrastructure, no manual tinkering or code changes required. That out-of-the-box automation can save hours, even days, of setup and instrumentation work.
The interface is similarly efficient: clean, modern, and intuitive. Navigating to the right information doesn’t require endless clicking, and the dashboards feel polished. Teams can build custom views, track service levels, and visualize complex environments without writing code; or they can rely on the default dashboards and alerting profiles, which are well-tuned from the start.

Now, let’s talk brains. Davis AI. This thing is the MVP. It doesn’t just surface alerts, it understands context. Like, if there’s an issue affecting performance, Davis traces the root cause and points it out with actual reasoning. No more hunting through logs or metrics hoping to find a clue. It proactively flags anomalies, correlates events, and gives me that aha! moment within minutes. Combined with distributed tracing, it makes it ridiculously easy to follow a user transaction across multiple services and spot where things are slowing down.
Dynatrace’s monitoring coverage is broad: teams can track infrastructure, API performance, logs, and Kubernetes from the same pane. It integrates cleanly with major clouds (e.g., AWS) and supports OpenTelemetry, making it straightforward to pipe in external telemetry. For complex, large-scale environments, ActiveGates help manage traffic routing and data collection, keeping observability reliable as architectures grow.
G2 customer reviews often call out Dynatrace’s end-to-end visibility and Davis AI’s knack for pinpointing root causes, linking real user sessions with traces, logs, and metrics so teams can resolve issues before they impact customers. OneAgent setup is another highlight in verified reviews on G2: automatic discovery reduces manual config and speeds time to value.
That said, patterns in G2 reviews (and hands-on use) point to a real learning curve once you move beyond the basics. Mastering Dynatrace Query Language (DQL) and configuring advanced alert conditions takes time, and the UI — while powerful — can feel dense with features and tabs, especially for teammates new to observability. Pricing is also a consideration: as data volumes grow (metrics, logs, sessions), the enterprise-grade model can feel heavy for smaller companies or early-stage teams.
Even so, G2 review data consistently positions Dynatrace as a high-impact platform for organizations that need AI-assisted, full-stack monitoring with UX context. With a bit of enablement on DQL and thoughtful scoping of data ingestion, most teams see clear gains in detection speed, root-cause clarity, and confidence during incident response.
What I like about Dynatrace:
- The AI is insanely helpful. Davis AI basically watches everything for me and alerts me before issues even cause problems. It’s like having a super-smart assistant monitoring our apps 24/7.
- OneAgent is a game changer. I installed OneAgent, and it automatically discovered all our services and dependencies. No complex setup, no juggling different configs. It just works.
What G2 users like about Dynatrace:
“Dynatrace excels in API monitoring, data analysis, and business analysis, making it incredibly useful for our day-to-day operations. What stands out most is its ease of use and the number of features it offers. Despite being a powerful tool, the interface is intuitive, which made the implementation process smooth for our team. Its integration with our existing systems was seamless, and the platform offers great visibility into all data points. Customer support has been responsive and helpful, ensuring we get the most out of the tool. We use this daily to track the issue and successive sessions”
– Dynatrace Review, Karan S.
What I dislike about Dynatrace:
- It’s not the easiest tool to learn. The query language (DQL) and sheer number of features can be a bit overwhelming at first, especially for new team members.
- It gets pricey fast. Honestly, once you start tracking a lot of metrics and logs, the cost adds up. Not the most budget-friendly option out there.
What G2 users dislike about Dynatrace:
“While Dynatrace offers incredible insights, its extensive features can feel a bit overwhelming at first. The platform has a steep learning curve, and it takes time to fully understand and navigate all the capabilities. Additionally, the pricing can be quite high for smaller teams or businesses, especially when scaling up. While the performance is top-notch, the cost can sometimes feel like a barrier to maximizing its potential, particularly for startups or mid-sized companies.”
– Dynatrace Review, Sushanth N.
Watching mobile sessions is powerful. It’s even better with app-specific insights. Discover top mobile analytics tools to round out your mobile UX strategy.
5. Microsoft Clarity: Best for free session recordings and heatmaps
Microsoft Clarity is an epic tool that is completely free. Like, no hidden upgrade tiers, no “limited access”, just everything unlocked from the jump. Clarity is one of the leading session replay solution for small businesses, offering unlimited features for free with zero technical setup barriers.
Setup is straightforward: installed via Google Tag Manager, Clarity is typically up and running in minutes, no developer lift or lengthy implementation guides required, which isn’t the case with many analytics tools. The native GA4 integration is a major plus; teams can pair Clarity’s session-level insights with broader traffic and conversion data from Google Analytics to see not just who visited, but why they bounced or converted.
Feature-wise, the value is immediate. Heatmaps reveal which page elements attract clicks (and which get ignored), while scroll maps show how far visitors actually read — crucial for content layout decisions. Session recordings add the “why” behind the metrics: watching real users move through a flow surfaces design snags, broken elements, and confusing navigation patterns that raw numbers alone wouldn’t expose.
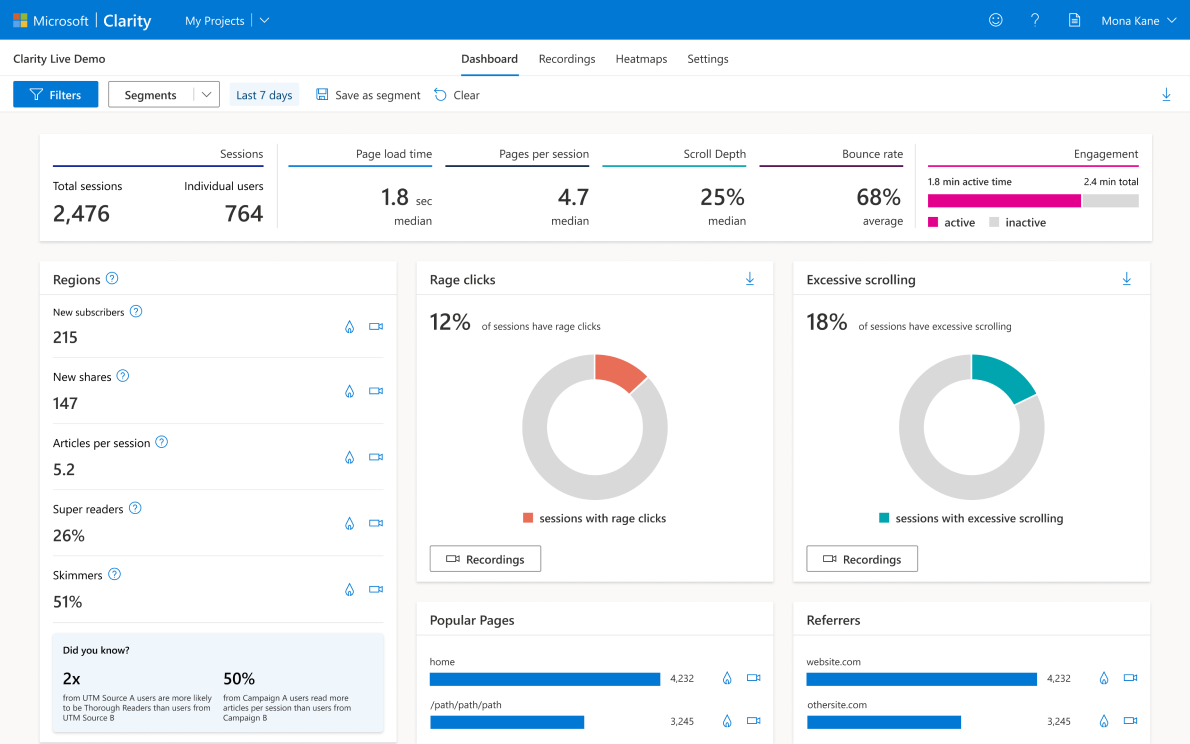
Verified reviews on G2 often highlight Clarity’s biggest strengths for small teams: genuinely free, quick to set up, and packed with practical essentials like session recordings, click/scroll heatmaps, and rage-click detection. Many non-technical users call out how easy it is to get value without a long onboarding curve.
Insights from G2 reviewers note a few considerations to plan for. The UI has a learning curve around filters — they’re powerful, but not always intuitive at first. Data refreshes aren’t truly real time, which can slow live debugging, and several users would welcome advanced capabilities such as goal tracking or richer journey mapping. G2 user feedback also mentions that the default 30-day data retention can feel short for quarter-over-quarter analysis.
Even so, G2 review data continues to position Clarity as a high-value option for lean teams: no-cost capture, straightforward heatmaps, and dependable session replays. If you pair Clarity with GA4 goals/journeys, set simple filter presets, and export key clips periodically, you retain most of its benefits while sidestepping the common limitations.
What I like about Microsoft Clarity:
- It’s totally free and packed with features. I still can’t believe Clarity gives me unlimited session recordings and heatmaps without charging a dime. For a free tool, it feels surprisingly full-featured.
- The filters are super specific and helpful. I love how I can filter recordings by things like specific pages, devices, or even user locations. It makes it way easier to pinpoint behavior patterns.
What G2 users like about Microsoft Clarity:
“It is free, and very easy to use, it automatically integrates and connects with the GA4 property. Plus the feature of unlimited visitor recording and tracking was not available in any free tool.”
– Microsoft Clarity Review, verified user.
What I dislike about Microsoft Clarity:
- Sometimes when teams want to review a just-completed session, the replay can take a bit to appear, updates aren’t truly real time.
- Microsoft’s layout choices can also be confusing at first (e.g., a vertically scrolling filter panel arranged horizontally), which isn’t the most intuitive.
What G2 users dislike about Microsoft Clarity:
“Sometimes the recordings are buggy, it tells me that the session was 13 mins long but the video doesn’t sync with that.”
– Microsoft Clarity Review, verified user.
6. Contentsquare: Best for enterprise-grade journey insights and growth
Using Contentsquare feels like finally having that long-overdue conversation with your website where it tells you everything your users are doing, why they’re leaving, and where the bottlenecks really are. Contentsquare is also one of the more affordable session replay services for medium-sized ecommerce sites, balancing deep analytics with cost-conscious pricing models.
One of the most impactful capabilities is Session Replay. Teams can watch real user sessions, click by click, scroll by scroll, turning production behavior into a goldmine for uncovering bugs, confusing layouts, and missed conversion opportunities. Seeing interactions unfold in real time provides clarity that raw metrics alone can’t deliver.
Journey Analysis adds complementary depth. While it may look complex at first, once understood it becomes a go-to tool, clearly mapping user flows to pinpoint drop-offs, highlight high-performing pages, and surface where optimizations are needed.
What often seals the deal is the data visualization layer. The platform converts dense behavioral data into accessible charts, heatmaps, and dashboards that are easy to interpret, and to present to stakeholders. The CS Live capability inside the browser provides real-time feedback during launches or major campaigns, saving valuable time when rapid iteration matters most.

Training proves smooth in practice. By using CS Academy and recorded sessions, teams can get up to speed faster than expected. The Customer Success team often goes above and beyond, readily walking through setups and offering proactive tips, and the CS Community serves as a reliable fallback for niche questions or seeing how other organizations tackle similar challenges.
G2 customer reviews often praise Contentsquare for turning dense behavior data into clear visuals — zone-based heatmaps, journey analysis, and impact quantification make it easier for product, UX, and growth teams to spot opportunities that lift conversions and revenue.
Insights from G2 reviewers note a few areas to refine: some tasks can take a couple extra clicks, load times may slow when you’re pulling heavier session data, and integrations (e.g., GA4 or A/B testing tools) can require more setup and occasional help from support. A handful of users also mention that getting everything wired the first time takes longer than expected.
Even so, notable patterns in G2 reviews describe Contentsquare as a strong, enterprise-ready choice for customer journey insight. Once integrations are in place, teams value the depth of analysis and the way findings translate into prioritized, high-impact UX improvements.
What I like about Contentsquare:
- I love how visual the data is. The heatmaps, dashboards, and journey analysis make it super easy to see exactly how users are behaving, no guesswork, just clear visuals.
- It integrates well with our existing tools. Once everything was set up, I appreciated how well Contentsquare plugged into the rest of our tech stack, especially for cross-platform insights.
What G2 users like about Contentsquare:
“With Contentsquare, we are able to understand user behavior on our website greater detail and precision than we ever could before. And, contentsquare has a wide variety of reports and views, so we are able to answer so many types of questions. For example, page usage, impact of elements on conversion rates or revenue, journey analysis, etc.
Also, I have to callout how amazing their customer success and customer support teams are! They are very proactive, fast to respond, amazing to work with, and very knowledgeable. They really helped my team be successful within the tool.”
– Contentsquare Review, Parker S.
What I dislike about Contentsquare:
- It can take time to get comfortable; the platform isn’t fully plug-and-play, and there’s a learning curve before teams feel confident using all features.
- Frequent updates shift layouts and flows; while improvements are welcome, users may need to reorient periodically as elements move or behave differently.
What G2 users dislike about Contentsquare:
“It takes some time to get settled in the tool. Which can be somewhat frustrating.”
– Contentsquare Review, verified user.
7. PostHog: Best for product analytics built for engineers
When I first got my hands on PostHog, I wasn’t expecting it to be this loaded. It felt like someone took everything I needed for product analytics, session replay, and feature flagging, and wrapped it into one tool and then somehow made it free to start with.
Setup was a breeze. I integrated it with my Next.js project in minutes — and I’ve seen people successfully hook it into React Native, SvelteKit, and even Kotlin Multiplatform. The docs covered just enough to get me rolling, and for the few things I was unsure about, the support team was surprisingly responsive. That said, I’d love to see the docs go deeper on edge cases, especially for mobile setups. Setting up PostHog for self-hosting did take some extra time and effort configuring the environment and scaling it was a bit of a weekend project. But once it was up, it felt rock solid.

Now, let’s talk Session Replay. Hands down, one of the most valuable features for me. Watching actual user sessions (with all their clicks, scrolls, and hesitations) helped us uncover friction points we couldn’t have guessed from pure event data. It’s perfect for debugging bugs and improving the user journey. I did notice some lag and rendering hiccups in longer sessions, and the color fidelity was a little off sometimes, but the value far outweighs those nitpicks.
I’m a huge fan of the custom events and properties setup. I could define what mattered most to my product and send that data through with minimal code changes. And their API, especially the Swift one, is solid. It gave us a lot of flexibility in how we wanted to structure and push our data.
The UI/UX is a refreshing change if you’re coming from something like Google Analytics. It actually feels designed for humans. For founders or product teams, PostHog is arguably the best session replay tool for SaaS startups, offering developer-focused features without enterprise pricing.
G2 user reviews often highlight PostHog’s “everything-in-one” approach — replays, product analytics, feature flags, and experimentation — so product and engineering can ship, measure, and iterate without stitching five tools together. The generous free tier and open-source option also make it accessible for startups and technical teams.
That said, there’s a learning curve early on. The UI can feel a bit full at first — great once you know your way around, but a lot to take in — and less technical teammates may need extra guidance to use advanced features. Insights from G2 reviewers also note that some deeper workflows (e.g., custom analytics setups or more complex experiments) benefit from docs or a quick enablement session.
Even so, notable patterns in G2 reviews position PostHog as a high-value pick for SaaS teams that want developer-friendly analytics with session replay built in. A short onboarding, saved views, and a few internal how-tos usually unlock the upside: faster debugging, tighter product loops, and fewer tool handoffs.
What I like about PostHog:
- PostHog brings everything together; session replays, feature flags, event tracking, user profiles, dashboards. I don’t need to juggle multiple tools anymore.
- The fact that it’s open source with a free tier that’s actually useful made it a no-brainer for me. Plus, the pricing model is super clear, no sneaky costs popping up later.
What G2 users like about PostHog:
“I heard their story from being the most expensive analytics tool to the cheapest one, which is just impressive. I still use PostHog Cloud for free, and I don’t know if I’ll get the opportunity to upgrade because the free tier covers almost everything we need. It is so easy to use, the dashboard is intuitive and the features are really useful for analyzing how my products are being used by my users. I get to know how my users behave with my product.”
– PostHog Review, Hemanth M.
What I dislike about PostHog:
- If I had to pick something, it would be the documentation. It’s not bad by any means, but I think it could be a bit better organized and more detailed in some areas, especially for edge cases or advanced use.
- Sometimes the UI is a little clunky. I found it to have some friction while generating insights using the metrics logged by posthog.
What G2 users dislike about PostHog:
“One of the difficulties I’ve had with PostHog is the learning curve for new users – it can be a bit steep because of the range of features available.”
– PostHog Review, Maxime H.
Frequently asked questions (FAQs) about the best session replay software
Have more questions? Find more answers below.
Q1. What are some easy-to-use session replay tools for non-tech businesses?
Clarity is a great no-cost starting point: simple setup, automatic session recordings, and click/scroll heatmaps without developer lift. For a bit more polish plus issue tracking, LogRocket adds user-friendly replays with console/network data to help non-technical teams spot problems faster.
Q2. What session replay software is best for app performance analysis?
When it comes to app performance analysis, the best session replay software is one that offers mobile session replay capabilities, along with performance monitoring features like slow page detection, crash reporting, and network request tracking. Tools like FullStory and LogRocket stand out for offering both behavioral insights and technical diagnostics in one platform.
Q3. What are some affordable session replay services for medium-sized ecommerce sites?
LogRocket’s entry plan is cost-friendly and surfaces rage clicks, JS errors, and performance issues tied to conversion paths. If you want free at first, Clarity can cover replays and heatmaps while you scale.
Q4. Top session replay platform for analyzing customer behavior on my website?
Fullstory excels at behavioral analysis — auto-captured events, funnels, and segments make it easy to quantify drop-offs and test fixes. Contentsquare is another strong option if you need journey impact analysis tied to revenue.
Q5. What is the best session replay tool for SaaS startups?
PostHog is a savvy pick: product analytics, feature flags, and replays in one stack, with generous free usage. LogRocket is also popular in early stages for fast, dev-ready debugging plus UX signals.
Q6. Which session replay software is most reliable for app developers?
Dynatrace connects real user sessions with traces, logs, and metrics; its AI (Davis) flags root causes that affect UX. For front-end teams, LogRocket’s console/network capture and error tracking make reproduction and fixes reliable.
Q7. What’s the leading session replay solution for small businesses?
If you’re looking for a low-maintenance tool with strong insights, Microsoft Clarity stands out as the leading session replay solution for small businesses. It’s free, simple to set up, and integrates well with GA4. G2 reviewers consistently highlight its accessibility and value for lean teams.
Q8. Which session replay software is most reliable for app developers?
For app developers, reliability means more than replays — it’s about debugging, performance, and integration. LogRocket and Fullstory are two of the most reliable session replay software options thanks to their JavaScript error logging, console insights, and mobile SDK support, especially when paired with developer workflows.
Q9. What is the best software for recording and replaying user sessions on desktop and mobile?
Fullstory and Contentsquare both provide high-fidelity replays across web and mobile, plus funnels and segmentation. If you want lightweight and free, Clarity records core interactions with minimal setup.
Q10. Recommended session recording apps for improving my user interface?
Use Fullstory to spot friction via funnels, segments, and heatmaps, then validate fixes with replays. LogRocket complements UI work by tying UX moments to errors and performance, so designers and engineers act on the same evidence.
See your site through your users’ eyes
Let’s take the guesswork out of understanding user behavior. These session replay tools go beyond numbers and dashboards; they show you the real story behind every click, scroll, and exit. Whether you’re trying to improve conversions, fix UX issues, or just understand what’s working (and what’s not), there’s a tool here that fits the bill.
For me, this whole process was about figuring out which platforms strike the right balance between insight and usability. I wanted tools that not only captured user sessions but actually helped me do something with that data. Whether it’s improving a form, tweaking a layout, or flagging an unexpected bug.
Now it’s your turn. Explore these tools, try a few out, and see which one gives you the clearest window into your users’ journey. Once you’ve seen your site through their eyes, you’ll never want to go back.
Want to dive even deeper into user behavior? Pair your session replay software with one of the best heatmap tools to visualize clicks, scrolls, and engagement patterns across your site.
Leave a Reply